How MAJiK IoT Connect works
The detail behind the short version: the four interfaces that drive one agent, the levels remote management can reach, and the configuration file that declares it all. Written for the engineer who wants to know exactly what runs where.
From a raw PLC tag to a value people can use
Reading the register is the easy part. MAJiK IoT Connect gives the value a type and a meaning, scales and state-maps it with over 20 built-in edge transforms, attaches the equipment and site it belongs to, and auto-classifies downtime by reason, all before it leaves your network. What publishes is data people can actually use.
One tag, transformed
Raw PLC register
DB10.DBW28 = 7242Publishes Messages
spBv1.0/NorthPlant/DDATA/edge-01/oven-1Zone1/Temperature = 72.42 °COne agent, managed the way you work
Every agent runs as a background service with one management interface. Drive it from the desktop app, the cloud console, the command line, the interactive terminal, or the config file directly. Managing one agent and managing every site work the same way.
Desktop app
A native app on your own computer for configuring agents, browsing tags, and watching live data. Point it at the agent on your bench or any agent on the network.
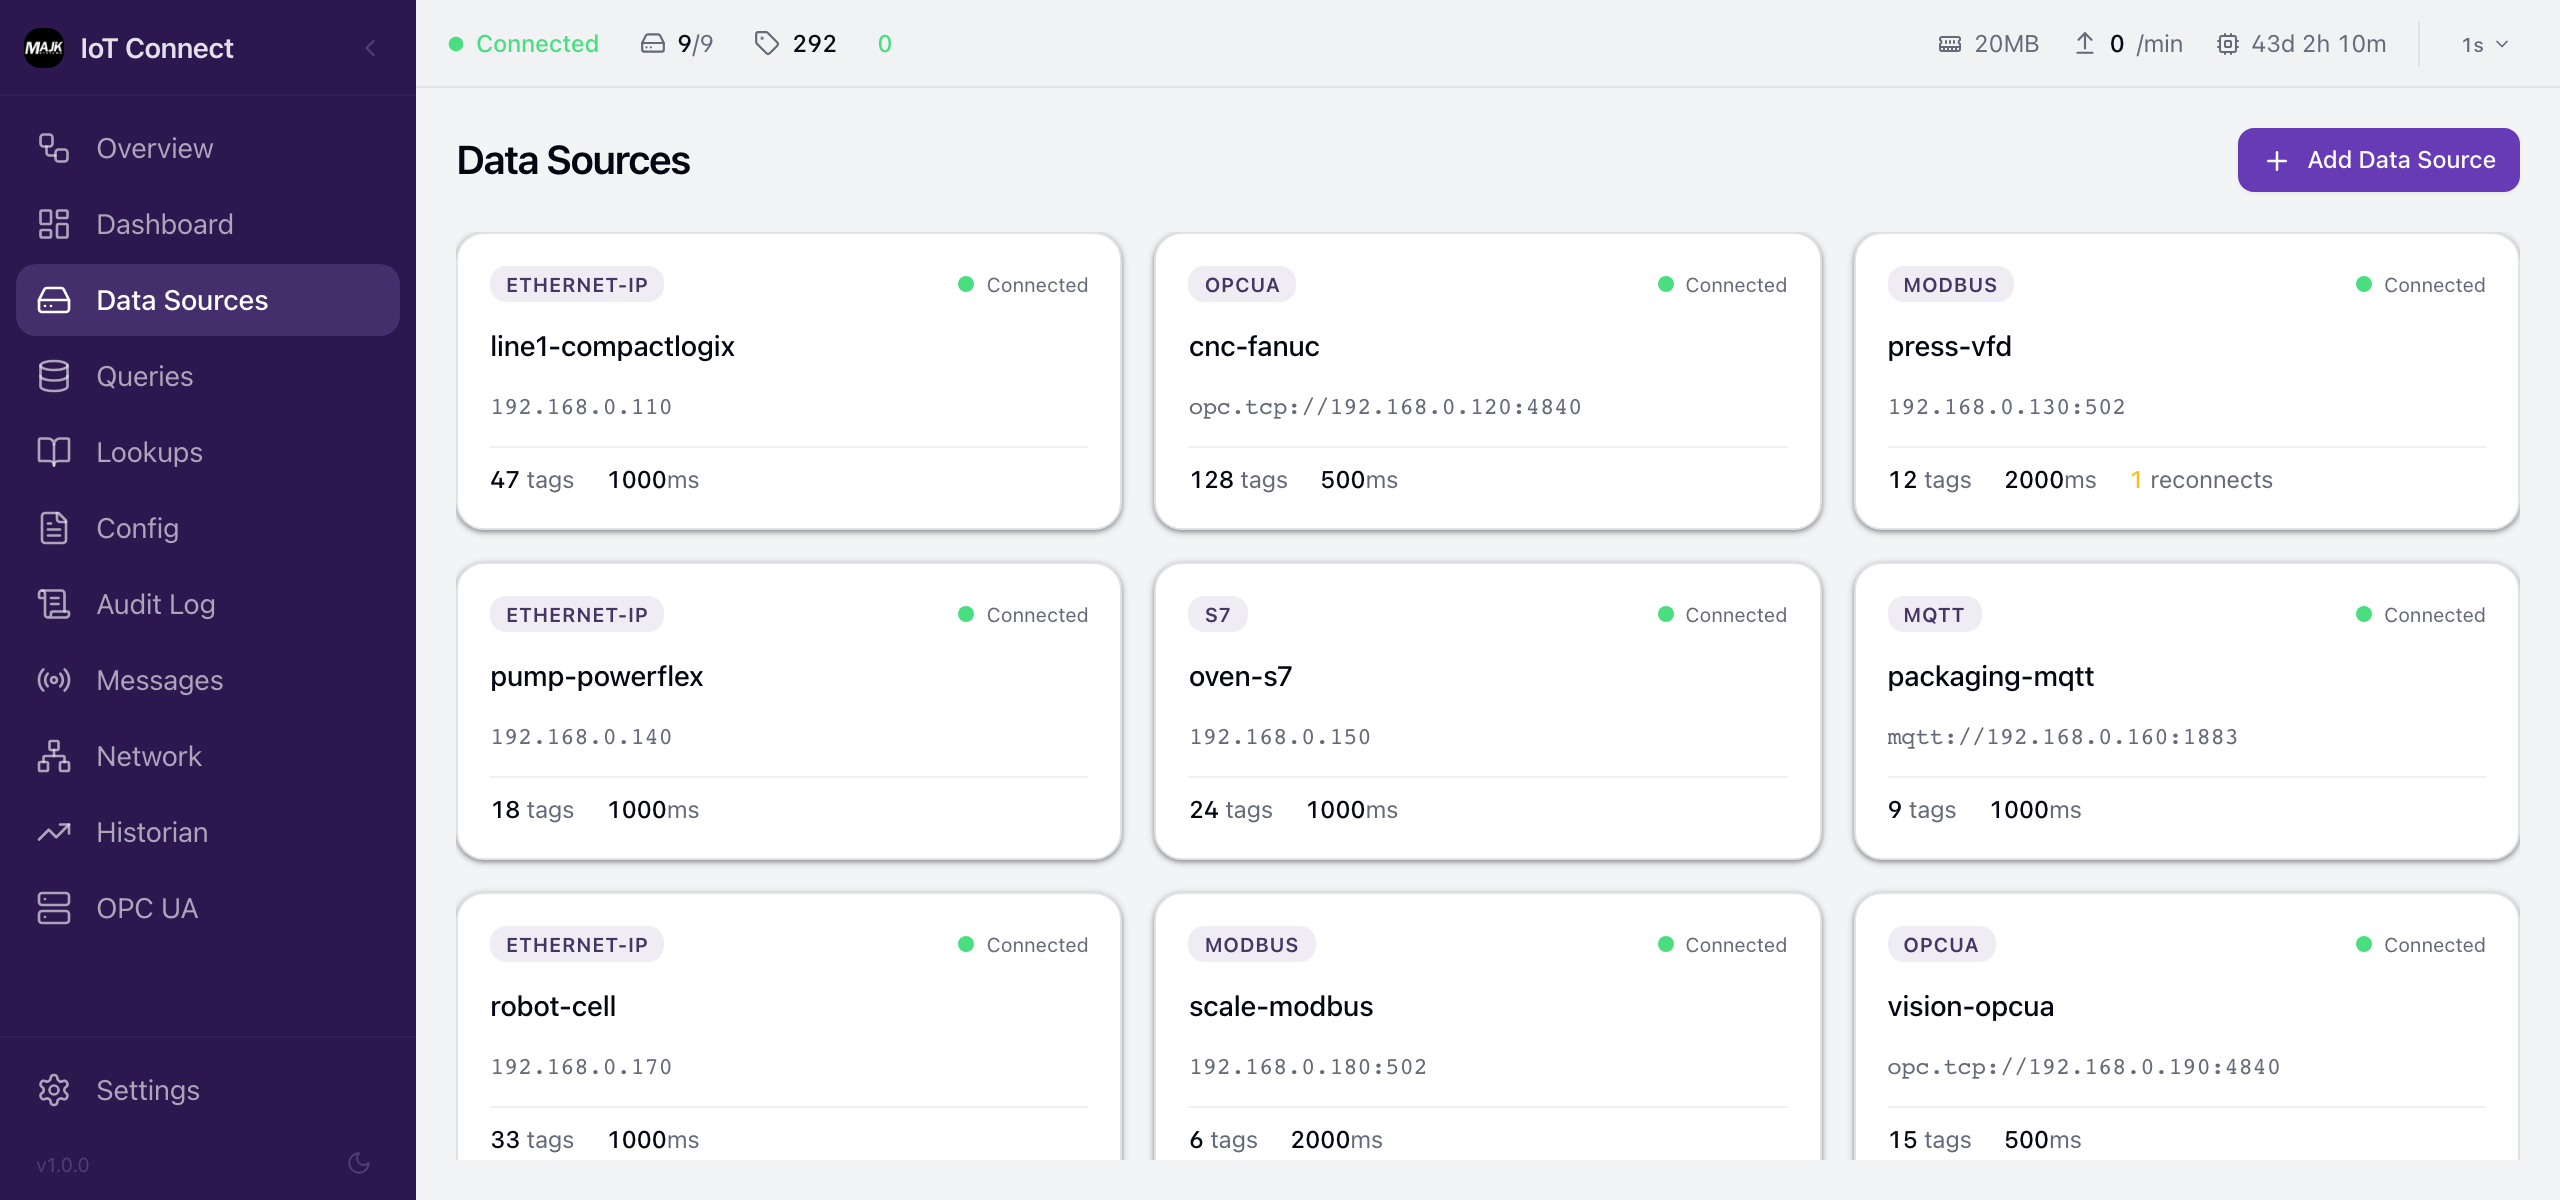
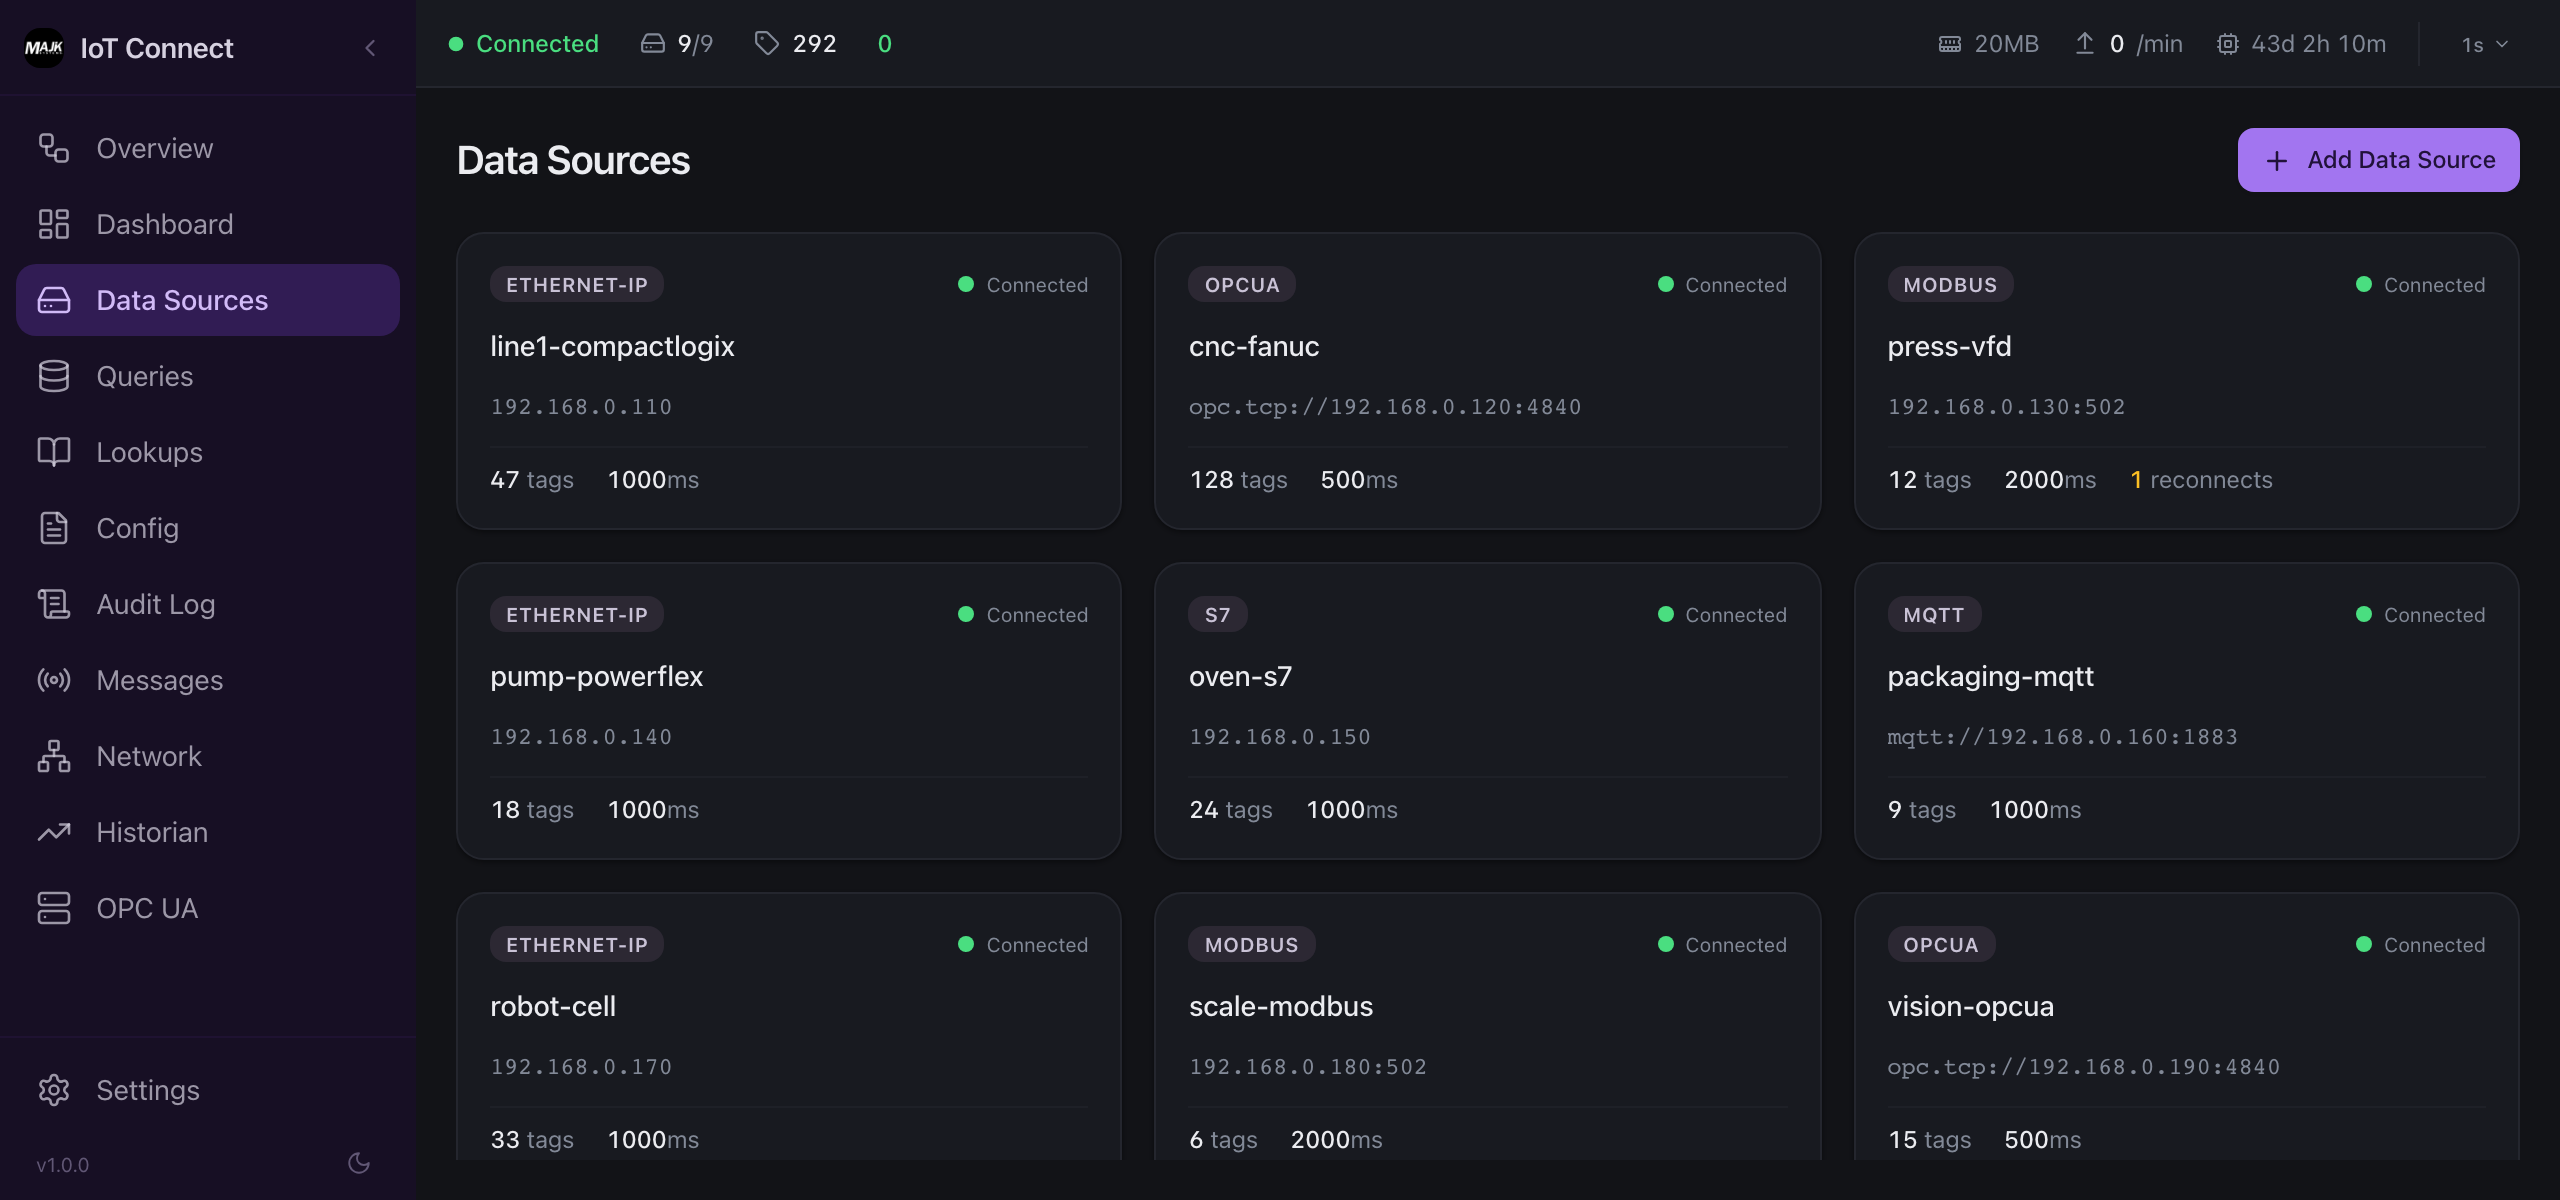
Cloud console
Coming SoonA web dashboard for managing every agent across every site. Push configuration, roll out updates, and watch fleet health from one place, in any browser.
Command line (CLI), the interface for AI
A scriptable command line, and the safe doorway for AI. Any model or robot reads live machine data through it, configurable per your security policy. Extra readers never add load, since every request routes through the brokering agent.
$ majik-edge read line1/oven-1/zone1-temp
line1/oven-1/zone1-temp = 72.42 °C [GOOD] @ 14:08:12
$ majik-edge read line1/oven-1/zone1-temp -o json
{ "tag": "line1/oven-1/zone1-temp", "value": 72.42, "unit": "°C", "quality": "GOOD" }
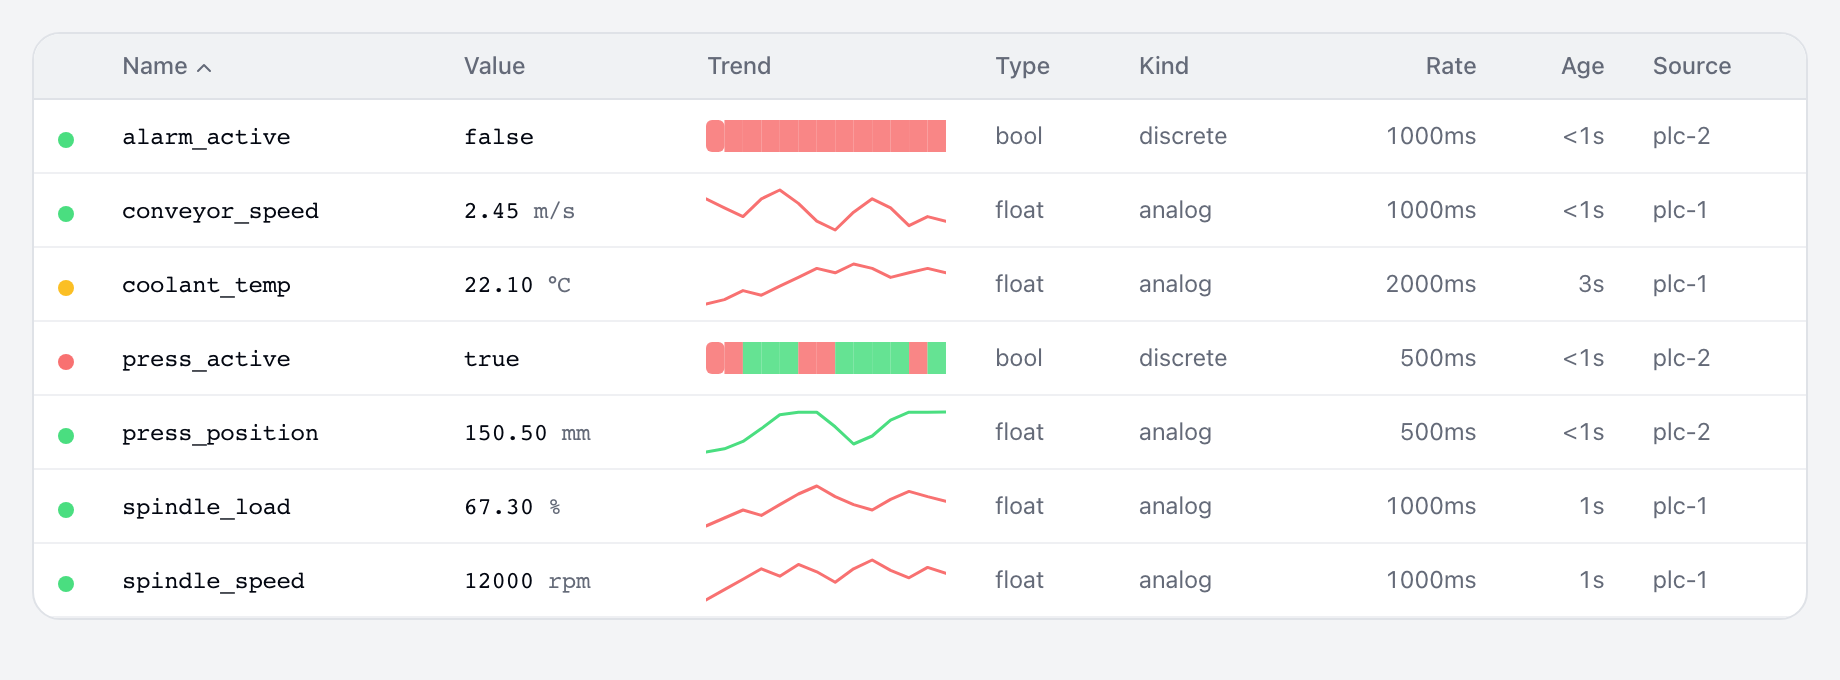
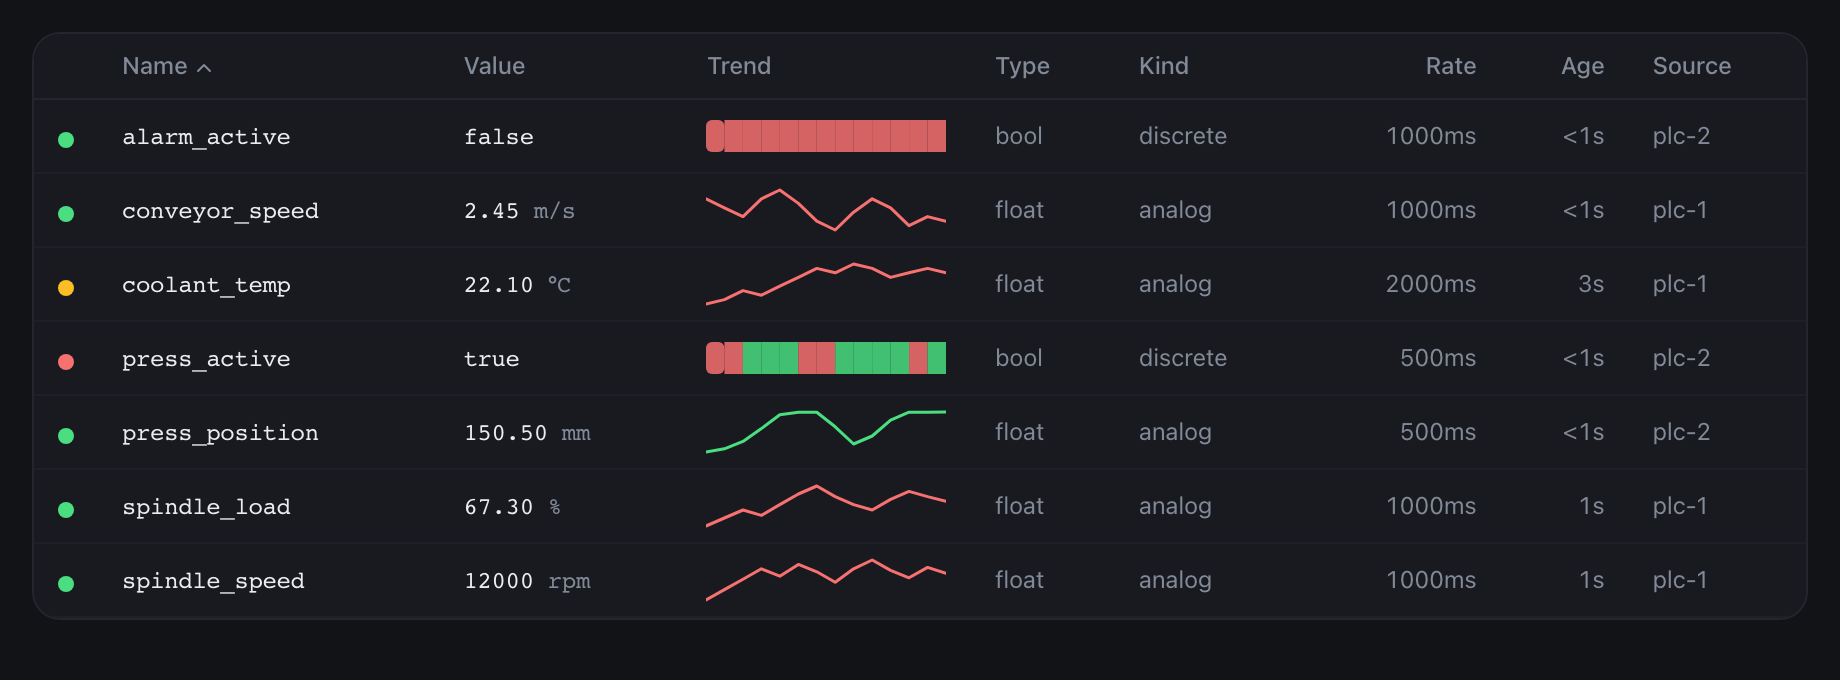
Interactive terminal (TUI)
A full-screen, keyboard-driven dashboard that runs right in a terminal window, for operators and engineers who live in the shell. Fully operable over a remote SSH connection, no browser required.
Configuration as Code
Everything an agent does is declared in one YAML file: the single source of truth for what it reads, the transforms it applies, and where it publishes. You never hand-write it. The four interfaces above all edit the same file.
The file is version-controlled and auditable, so you can review a change, diff it, and roll it back.
And it is testable. Assertions in the same file feed a raw value in and check what comes out, so a config mistake fails at your desk, not on the shop floor.
# agent-config.yaml
dataSources:
  - id: oven-plc
    protocol: s7
    endpoint: 192.168.0.20

equipment:
  - id: oven-1
    name: Oven 1
    path: NorthPlant/line-1/oven-1

items:
  - name: Zone1/Temperature
    dataSourceId: oven-plc
    equipmentId: oven-1
    address: DB10.DBW28
    datatype: Int16
    kind: timeseries
    unitOfMeasureId: CEL
    transforms:
      - type: scale
        params:
          multiply: 0.01   # 7242 -> 72.42 °C
assertions:
  - name: temperature-scaling
    item: Zone1/Temperature
    input:
      value: 7242
    expect:
      value: 72.42         # config validate: PASS
Every interface drives the same agent over one control plane: outbound-only, encrypted with TLS, and authenticated by the agent's own auto-rotating credential. No inbound ports.
Manage it at the level your security allows
You decide how far management reaches: keep it on the box, inside your corporate network, or in the cloud console. Every level runs over the same outbound-only, authenticated control plane, so the security model never changes. Only who can reach the agent does.
Three levels, all governed
Local
On the box itself. Nothing leaves the line, ideal for air-gapped sites.
Local network
Across your corporate network, inside your own firewall.
Cloud
Every agent and site from one cloud console.
Push config, roll out verified updates, and watch health, all over the same outbound-only, authenticated control plane.
The exporters, built in
The MQTT broker, the OPC UA server, the historian buffer, and agent telemetry ship inside the same binary. Nothing extra to install.
An MQTT broker inside the agent
Dashboards, HMIs, and anything else on the plant network connect straight to the agent's built-in broker. Data publishes as Sparkplug B, and the broker is safe by default: it binds to the local machine until you opt into network exposure with TLS and per-client authentication.
Sparkplug B native
Birth and death certificates and stateful metrics, not bare topics.
TLS and optional mutual TLS
Client certificates verified on connect; unknown clients are rejected.
Write-protected control topics
Untrusted clients cannot forge Sparkplug commands.
Cloud bridge
Streams Sparkplug B to MAJiK Visual Factory, or any broker you choose, and reconnects on failure.
An OPC UA server inside the agent
Every tag the agent collects is served as a live OPC UA address space, so SCADA, historians, and MES tools browse your equipment and subscribe to values the way they already know how. It serves data and accepts no writes.
Live address space
Your equipment hierarchy with real-time values.
Standard OPC UA security
Sign and SignAndEncrypt with modern security policies.
Certificate trust
Client certificates are held for approval in secured setups.
Read-only
Clients read the namespace; nothing writes back.
A historian inside the agent
When the uplink drops, the agent keeps collecting and writes every message to a time-series buffer on disk. On reconnect it drains in order, oldest first, so MAJiK Visual Factory sees a continuous stream instead of a gap.
Sized for real outages
100,000 messages or 1 GB, whichever comes first.
Ordered replay
Drains oldest-first on reconnect.
Survives restarts
On disk, not in memory; upgrades and power cycles keep it.
Automatic
No manual recovery steps when the link comes back.
OpenTelemetry inside the agent
The agent reports its own health as standard OTLP metrics and traces: scan timing, points collected and published, queue depth, and connection state. Point it at the observability stack you already run and watch the agent like the rest of your infrastructure.
OpenTelemetry native
Standard OTLP metrics and traces, plus an optional Prometheus /metrics endpoint, for any OTel-compatible backend.
Agent health metrics
Scan cycles, throughput, drops, reconnects, queue depth, and connection state.
Machine telemetry
Stream the machine data itself over OTLP into the same observability stack.
Kubernetes · Azure Arc · IoT Operations
Single host and high availability, out of the box
One agent on one box is production-grade: it restarts itself, keeps its buffer, and rides out network outages. Most sites run exactly that.
When losing a node is not acceptable, run a cluster on Kubernetes: Helm installs it, a Kubernetes Operator runs it, and one node per plant area collects its own equipment while standing in for the others. And if you run Azure IoT Operations, MAJiK IoT Connect can deploy alongside it on your Arc-enabled Kubernetes, publishing Sparkplug B into the AIO broker. Optional, not required: everything runs the same on any Kubernetes.
What the cluster handles for you
Automatic failover
A healthy node takes over a failed node's equipment within seconds.
One collector per device
Takeovers wait for the old connection to clear, so a connection-limited PLC is never asked for two.
One clean cloud stream
One node relays the site to MAJiK Visual Factory and buffers through outages: one continuous stream.
Kubernetes Operator rollouts
The Operator upgrades one node at a time, leader last, never dropping quorum.
Deploy with Helm on Kubernetes, run the same cluster on bare metal or VMs, or sit it alongside Azure IoT Operations on an Arc-enabled cluster.