
Downtime: why the five-minute stop is the expensive one
Everyone remembers the big breakdown. The line was down for three hours, maintenance was called, and it made the morning report. Breakdowns are dramatic, they get logged, and they get attention. Meanwhile, the stops that could be costing you the most go unnoticed, rarely logged by operators.
Short, frequent stops are a quiet tax on the line. They remain invisible because manufacturers assume that, even when unrecorded, they are still adequately captured as performance loss. It is an understandable assumption, but a costly one.
How much are short stoppages costing you?
Put rough numbers on it. A five-minute stop that happens ten times a shift is fifty minutes of lost runtime per shift. Run three shifts and that is two and a half hours a day, every day, on that one line. Across a full week of production it adds up to more than twelve hours, all without a dramatic event attracting attention to get it resolved.
The long breakdowns get a root-cause meeting. The micro-stops get a shrug, because no one ever saw them add up.
Why do short stops get overlooked?
Short stops get overlooked for two main reasons:
- They aren't recorded as individual events. Tracking every brief interruption manually is impractical, so their impact shows up as lower output without a clear record that stops occurred at all. Frequent interruptions become accepted as part of normal operations, and their cumulative impact goes unnoticed.
- They're buried in performance losses. Downtime reports that only include availability losses can leave micro-stops out entirely. That is because conventional overall equipment effectiveness (OEE) accounting groups micro-stops with reduced running speed, so stops get split between availability and performance losses. Unless short and long stops are brought together during your downtime analysis, the total impact of short stops can be overlooked during downtime improvement efforts.
Capturing all stops during scheduled production time and comparing their cumulative impact over a week or month helps identify where improvement efforts will make the biggest difference.
How accurate is operator-recorded downtime?
Capturing every stop accurately cannot depend on an operator and a clipboard alone.
Manual reporting requires operators to:
- Recognize exactly what qualifies as downtime.
- Recall every event and its timing.
- Record every stop, even when short, frequent, and recurring.
- Always be objective and honest.
And finally, every operator must act this way, consistently.
Put simply, reliable downtime reporting is a chain of requirements:
Recognition x Recollection x Recording x Objectivity x Consistency Across Operators
Meeting these requirements while also keeping production moving is difficult, even for the most diligent operators. Gaps in the resulting records can distort which problems appear to deserve the most attention. Calling those records "close enough" assumes you know the margin of error. But without an independent record to compare them against, that margin remains unknown.
How do you capture every stop automatically?
The answer is to capture each stop directly from the machine. Using data directly from the programmable logic controller (PLC), every stop can be detected and timed consistently, regardless of its duration or when it occurs. This creates a complete, objective record across every production shift while operators stay focused on what makes you money: producing.
With MAJiK Visual Factory, more than 80% of downtime can also be classified automatically from PLC data, so most stops arrive with both an accurate duration and a reason.
How do you find which downtime losses to fix first?
Once you have automated the capture of every downtime event, you'll want to rank losses by their total impact over a meaningful period. A week or month is a good place to start. Individual stops may be minor, but their cumulative impact over time may tell a different story.
Start by grouping and ranking downtime in one of three ways, depending on what you want to understand:
- By equipment: Which machines or stations account for the most downtime?
- By reason: Which recurring problems account for the most downtime across the factory?
- By product: Which products experience or contribute to the most downtime?
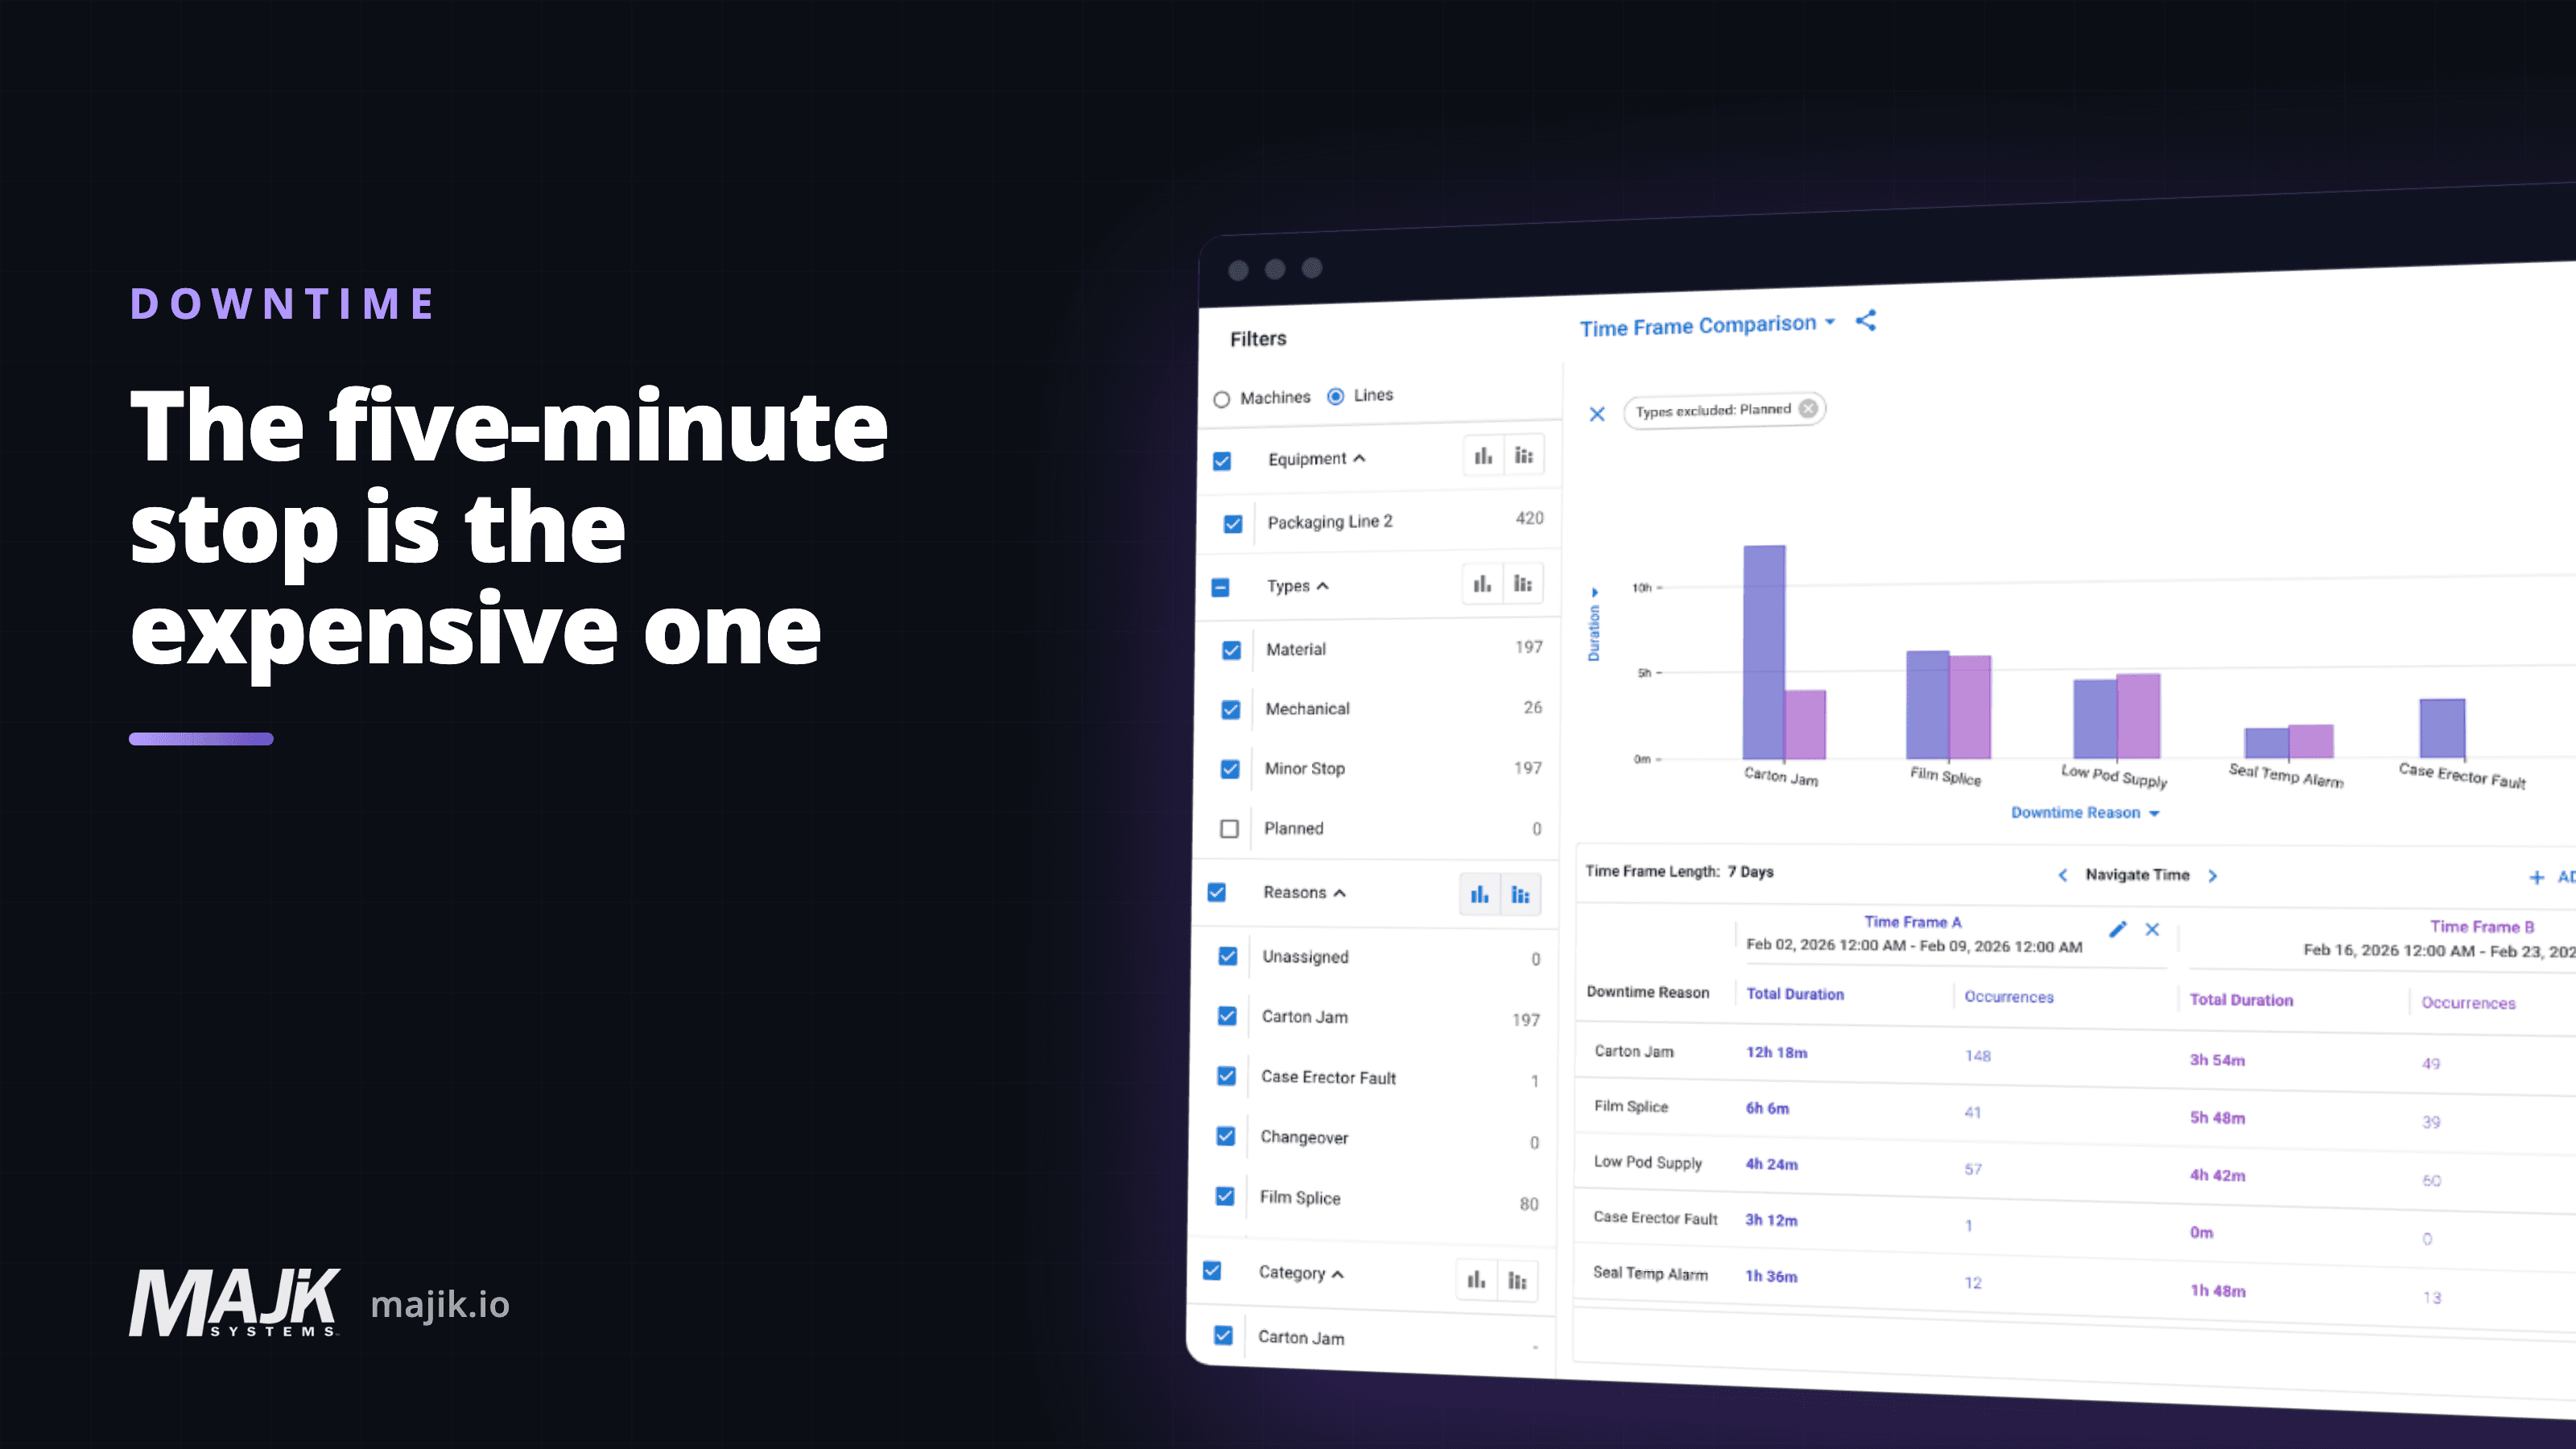
Here is one week on a packaging line, grouped by reason and ranked by the time each reason cost.
Suppose you begin with equipment:
- Identify the machines with the greatest losses.
- Filter to one machine, or a group of functionally similar machines.
- Regroup that filtered data by reason. This reveals which recurring problems are responsible for downtime within that equipment group.
- Evaluate each loss by both its total impact and how preventable it is. The largest loss is not always the best place to start: a slightly smaller but readily preventable problem may produce a faster and more dependable improvement.
- Make the change, then return to the same view and compare the results once enough similar production has occurred.
The real value of automatic capture is not the first Pareto chart. It is the next one, which shows whether the change actually reduced the loss.
MAJiK Visual Factory captures stops directly from the equipment, giving you complete information to identify, prioritize, and reduce the downtime costing you the most.
See every stop ranked by lost time with OEE and production monitoring.
Frequently asked questions
What counts as a micro-stop?
- A brief interruption to production, often lasting seconds to a few minutes. There is no universal duration cutoff. Conventional OEE accounting classifies minor stops as Performance losses, but they should still be recorded individually so their frequency, duration, and causes are visible.
Why do short stops go unrecorded?
- Because someone has to notice it, decide it is worth recording, and type it in. Under five minutes it is quicker to clear the fault and get the line running.
How do you capture them?
- Read the stop straight from the controller. Every pause is then timed and tagged however short, with no reporting threshold and no typing.
Are short stops really worth chasing?
- Yes. Repeated short stops can add up to more lost production than a major breakdown. Ranking them by cumulative duration and cause reveals where a targeted fix could recover the most production, whether the improvement appears under Availability or Performance.
How much downtime can be classified automatically?
- MAJiK Visual Factory automatically classifies more than 80% of downtime straight from the PLC, so most stops are already labeled before anyone touches a keyboard.
Related: automatic downtime classification, and live OEE and production monitoring.
About the author
Adam Singer
Co-Founder, Project and Product Manager
Adam co-founded MAJiK Systems in 2014 and leads project delivery and product development, bringing the voice of the customer directly into the product roadmap. With a background spanning software engineering, industrial connectivity, and manufacturing operations, he has spent more than a decade working directly with manufacturers to turn real production challenges into practical, intuitive software solutions that are easy to understand, adopt, and use.