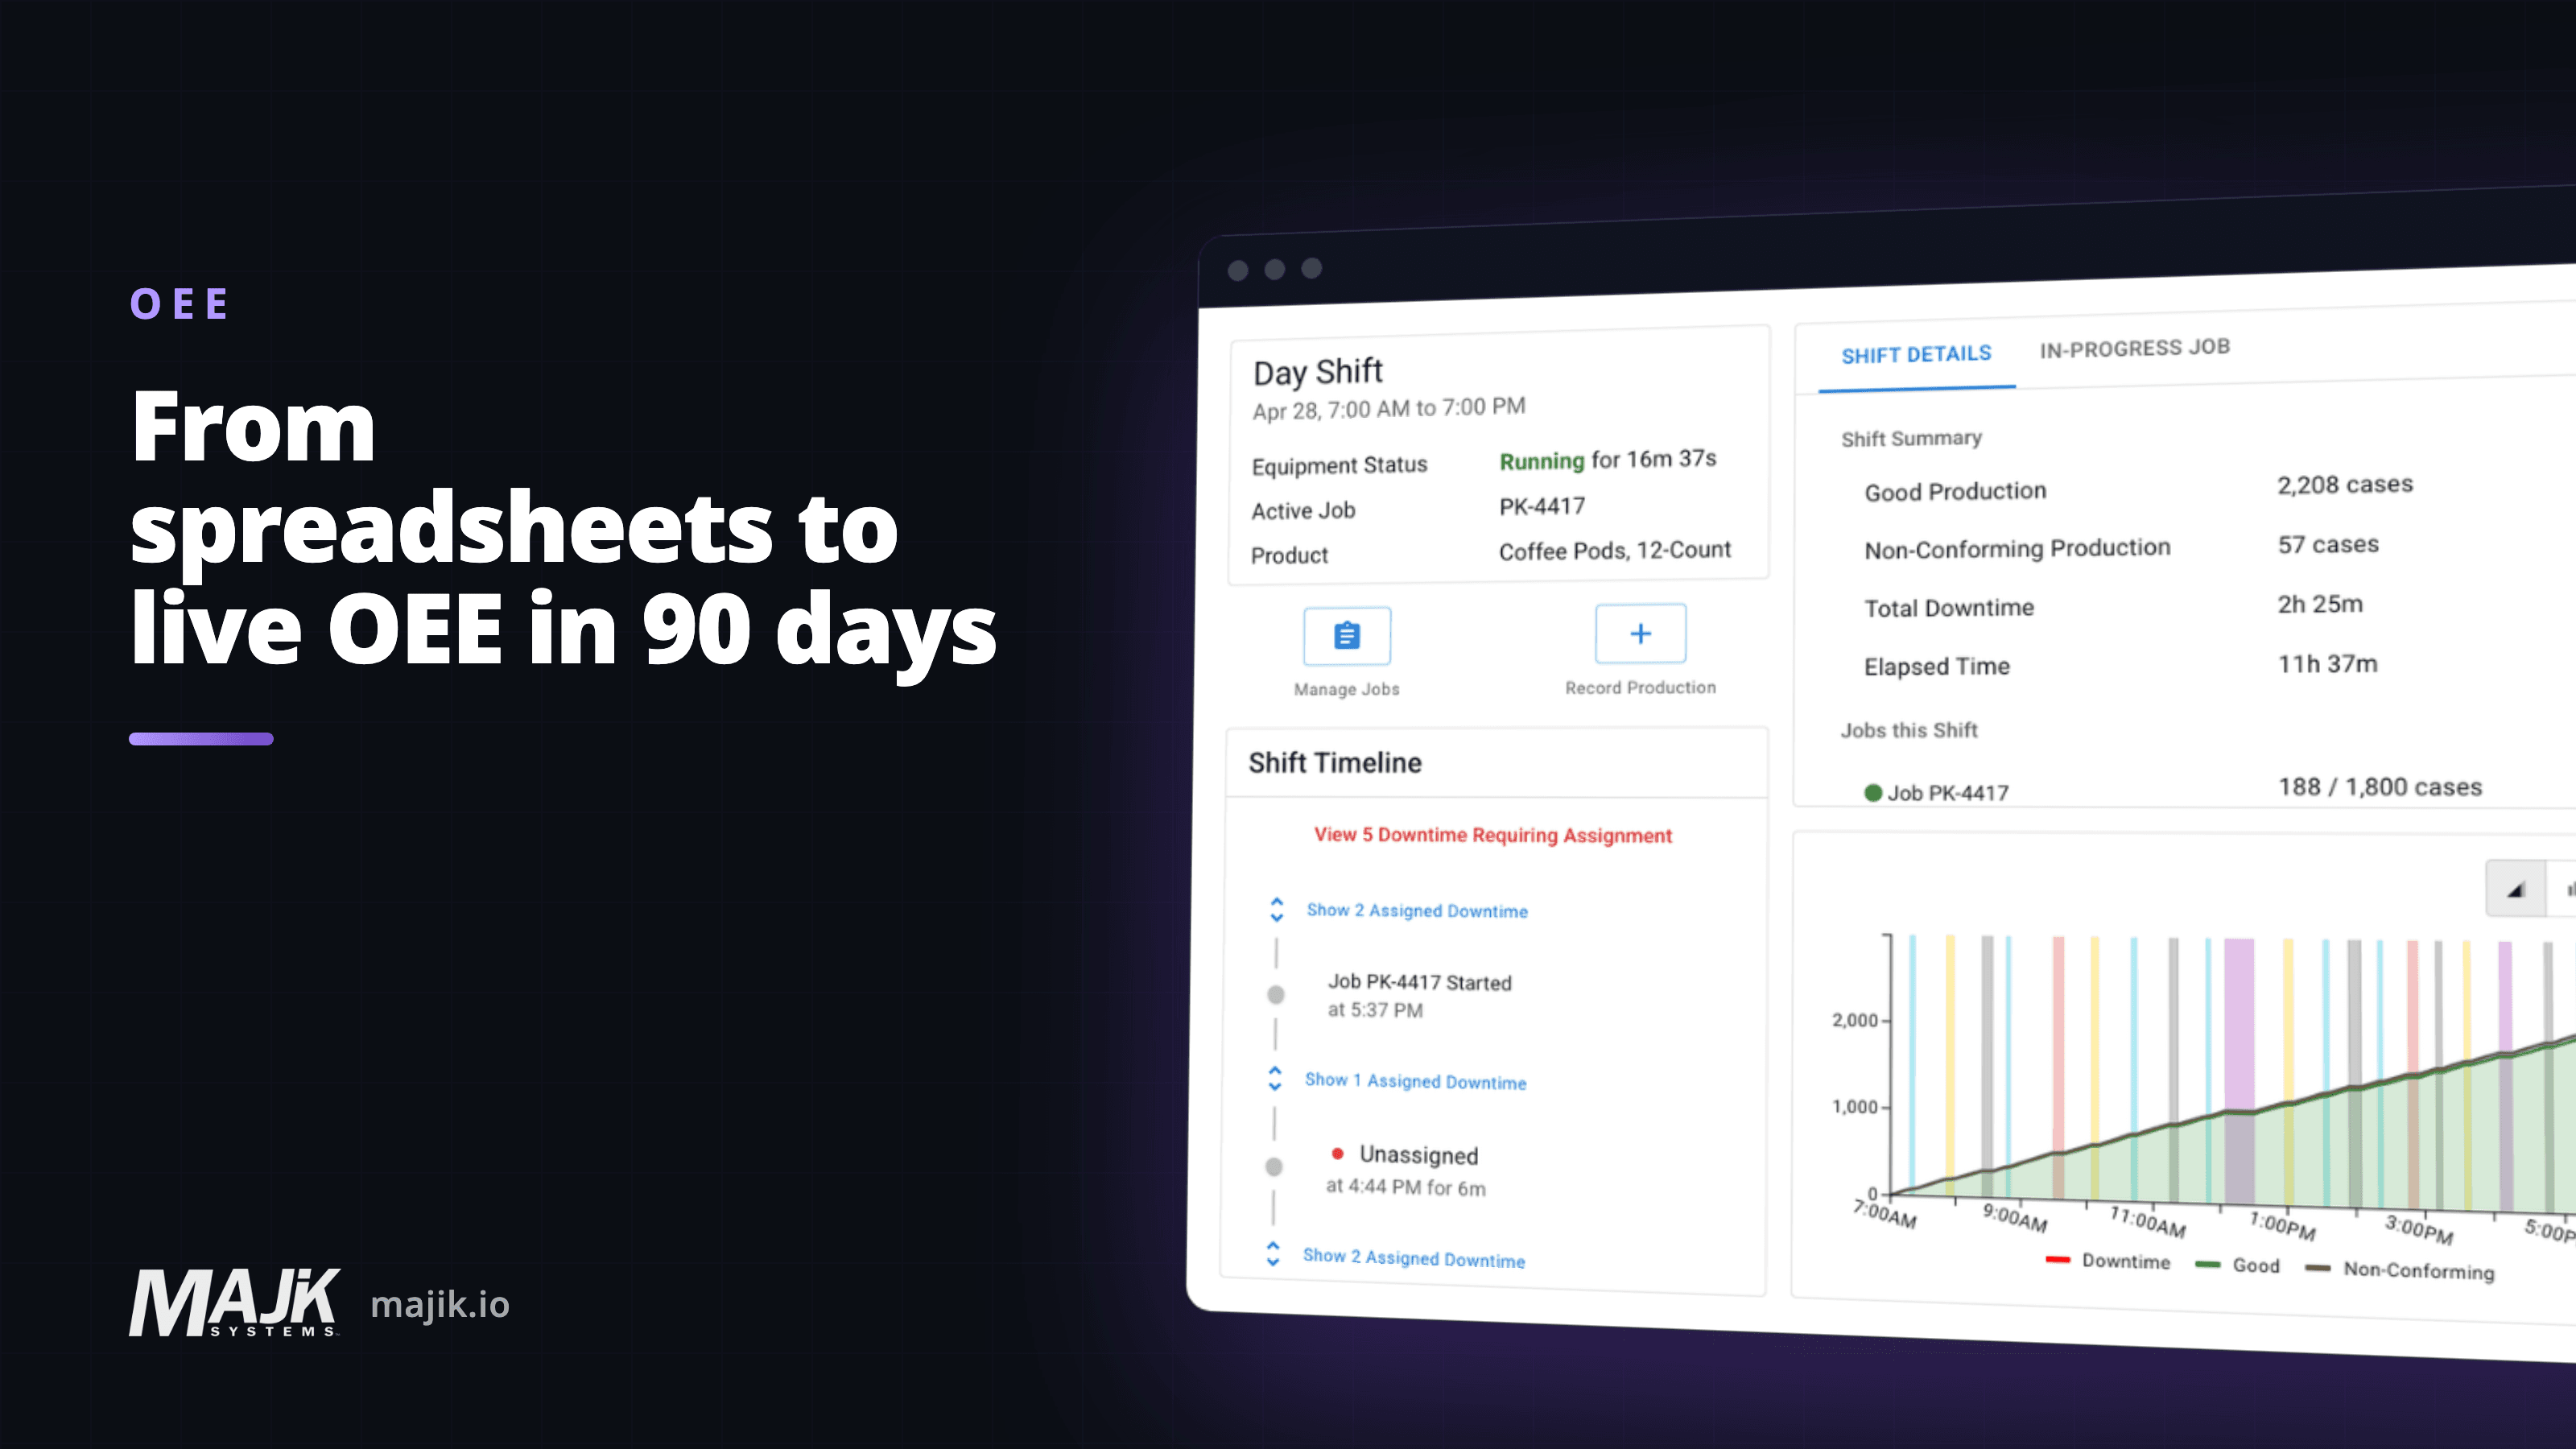
How to Use OEE to Find and Fix Losses That Matter
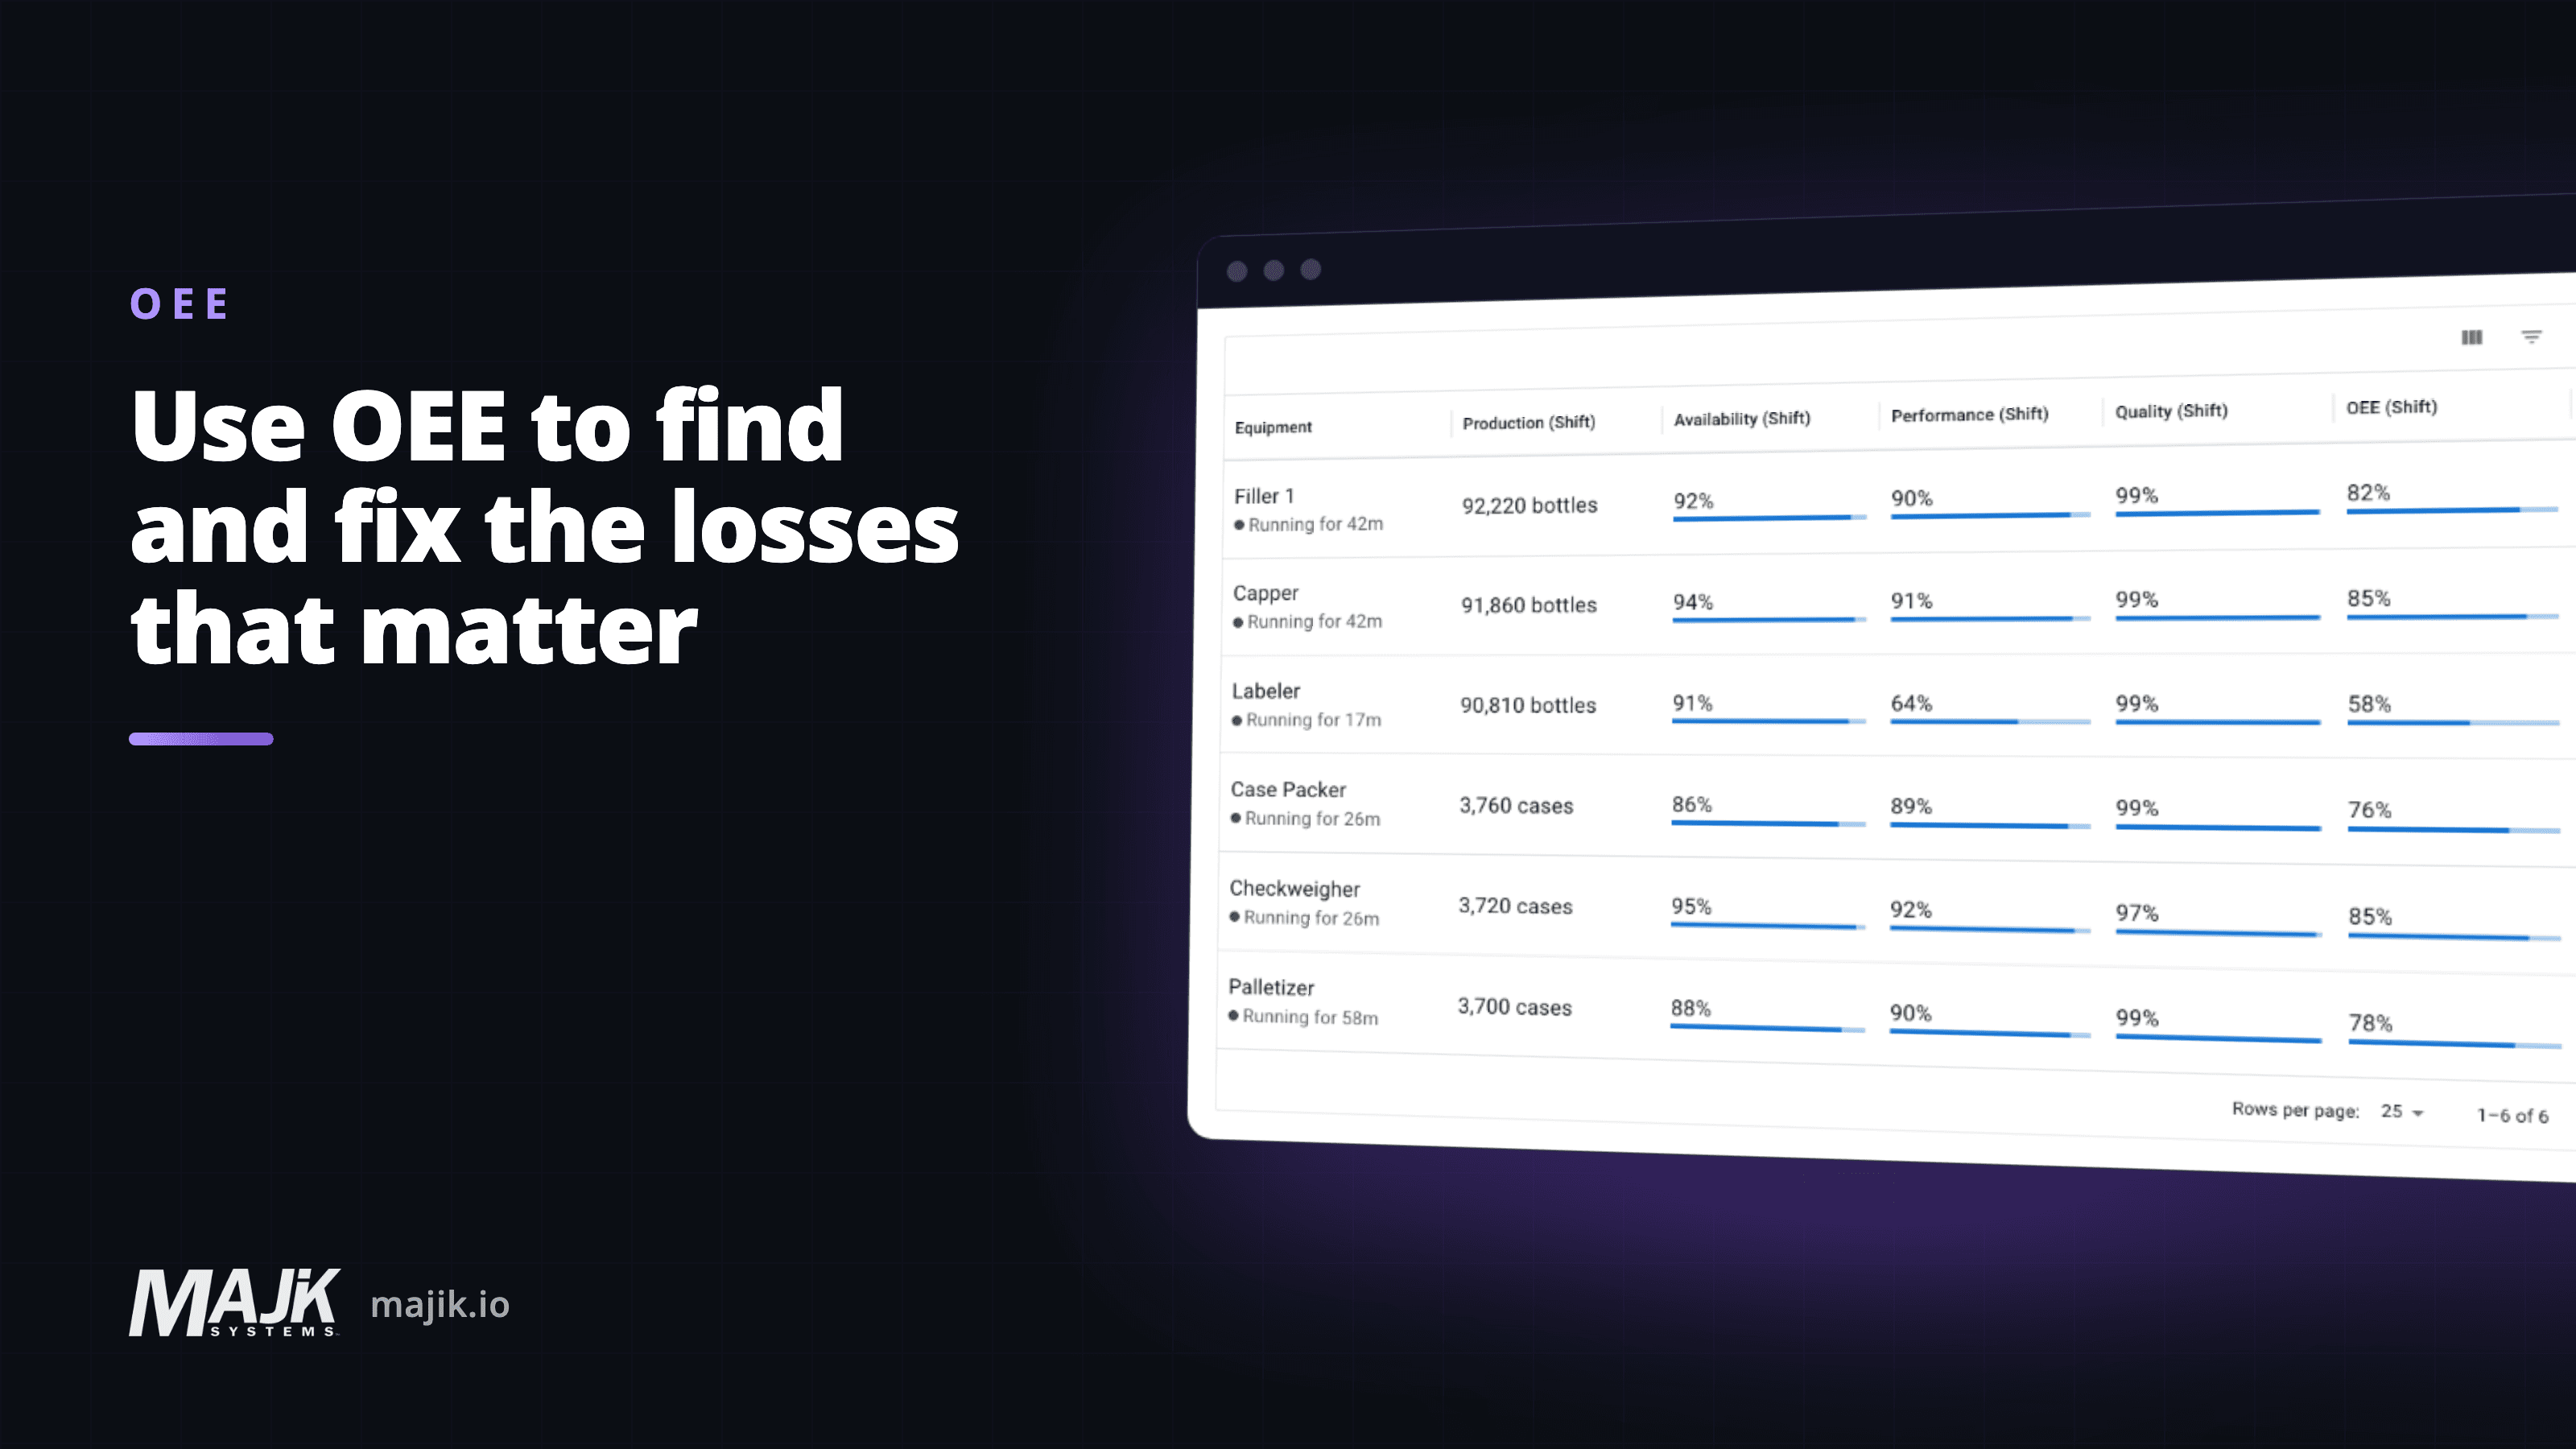
OEE can look like a score for your factory. Used properly, it is more like a beacon showing where scheduled production time is disappearing and which equipment, products, or processes deserve a closer look.
The value is not the score itself, but what it helps you find and improve.
What is OEE?
OEE is the percentage of your planned production time that was fully productive, in other words, making good parts, at the intended speed, while the equipment was scheduled to run.
Another way to visualize it is this: if you multiply a machine's OEE for a shift by the planned production time for that shift, the result is the equivalent amount of time the machine was producing at full capacity. You could think of it as the machine running perfectly for that amount of time, then being stopped for the remainder of the shift. That remaining time represents the combined impact of downtime, reduced speed, and quality losses.
OEE combines these three types of production loss into a single number, but each component answers a different question:
- Availability: Did the equipment run when it was scheduled to?
- Performance: When it ran, did it run at the ideal speed?
- Quality: Of what it produced, how much was good?
Multiply Availability × Performance × Quality and you get OEE.
For example, 90% Availability × 95% Performance × 99% Quality gives an OEE of about 85%.
What is OEE used for?
OEE is primarily used as a beacon to identify where losses are occurring, and measure whether those losses are improving over time.
During production, OEE gives you a quick indication of how effectively equipment or a shift is running. If the number is low or drops unexpectedly, you can drill into its three parts to see where the losses are coming from and course-correct while the events are still fresh.
OEE also gives you a single normalized measure to compare and communicate operational performance across different periods and production contexts. You can compare this week to last week, one shift to another, one piece of equipment to another, or even production runs of different lengths. Over time, those comparisons become a trend that shows whether operational performance is improving, which areas consistently account for the greatest losses, and whether the improvements you make actually hold.
What does OEE not tell you?
OEE's blind spots are by design, not a defect. It is a measure of how effectively planned production time was used, not a complete diagnosis of the production system. Here is what it is not designed to tell you.
OEE does not tell you how much you produced
A production run with a lower OEE can still produce more parts simply because it ran for longer, had a higher ideal production rate, or was scheduled for more time.
OEE tells you how effectively you used the opportunity to produce, not how much you produced.
OEE does not tell you whether you have spare capacity
OEE only measures the time you planned to run. Time that was never scheduled for production sits outside the calculation.
That means a line could have a very high OEE while only being scheduled for a small portion of the week. OEE can tell you how effectively those scheduled hours were used, but it cannot tell you how much unused calendar capacity remains. That is closer to what TEEP (Total Effective Equipment Performance) is designed to measure.
OEE does not tell you which equipment is the bottleneck
A machine can have poor OEE without constraining production, while another machine with a much higher OEE may still be the bottleneck because demand on it is greater.
Identifying the constraint is a separate exercise. Once you know where the constraint is, OEE becomes much more useful for understanding and reducing the losses occurring there.
OEE does not tell you which loss you should chase first
A low OEE tells you that productive time is being lost, but the headline number does not tell you why.
The first step is to break OEE into Availability, Performance, and Quality to see which component is contributing the most loss, if any. From there, you still need to drill into the underlying downtime reasons, speed losses, or defects, then consider their potential for improvement to determine what is actually worth fixing.
OEE points you toward the problem; it does not diagnose the root cause or set the improvement priority for you.
How do you use OEE to improve?
The basic improvement loop is simple: find the loss, understand it, improve it, then see if it stays improved.
Start with comparing OEE numbers to identify equipment, shifts, products, or production periods that deserve a closer look. Then break the number into Availability, Performance, and Quality to see where the loss is occurring.
From there, drill into the detail behind that component:
- If Availability is low, look at the downtime events and reasons consuming the most scheduled time.
- If Performance is low, look for reduced speeds, small repeated stops, or products that consistently run below their expected rate.
- If Quality is low, look at when and why scrap, rejects, or rework are occurring.
The largest loss is not automatically the best one to attack. Before deciding where to focus, weigh:
- Why it is happening.
- How much of it is realistically preventable.
- What it would take to improve.
Once you make a change, keep watching the same loss over subsequent production runs. If it decreases and stays down, you have evidence that the improvement worked. Then repeat the process with the next meaningful opportunity.
How can OEE support larger operational decisions?
Once you have enough history, OEE can provide useful evidence for the tough calls.
If a particular product consistently creates excessive losses, that information can contribute to decisions about pricing, process changes, where the product should run, or whether it is worth producing at all.
Likewise, if a line consistently loses significant production time to problems that are expensive or impractical to eliminate, OEE can help build the case for upgrading or replacing the equipment.
The important distinction is that OEE should inform these decisions, not make them. OEE contributes by showing where productive time is being lost and how significant those losses are. Whether they are worth addressing depends on demand, margin, the cost of improvement, and the other opportunities available.
How do you make OEE trustworthy?
The OEE formula is simple. The challenge is making sure the data and rules behind it are accurate and consistent.
Ideal run rates can vary by product and equipment, so the right standard has to be applied to each production run. Lost time also has to be classified consistently: a stop might count against Availability, a micro-stop against Performance, while some planned events may be excluded from production time entirely.
Then there is the data itself. Manual logging can be unreliable, especially when operators are focused on keeping the machine running. Production data is also often scattered across machines, spreadsheets, ERP systems, and other software. Bringing it all together takes time and can mean OEE is not available until after the shift or day has ended.
OEE is only as good as the data and rules beneath it. If either is wrong, it can point you away from the real opportunities and decisions that matter.
MAJiK Visual Factory solves this by pulling directly from the equipment and systems where the source data already lives, and calculating OEE consistently as production happens.
From there, teams can compare OEE by equipment, product, shift, or time period, follow trends over time, and drill from the headline number into the downtime, speed, and quality losses behind it. That turns OEE from a report into a practical tool for finding improvement opportunities and tracking whether the changes actually worked.
Frequently asked questions
What is a good OEE score?
- There is no universal pass mark. What matters more is how OEE compares with your own history under similar operating conditions and whether the losses behind it are improving. Published benchmarks can provide context, but product mix, equipment, schedules, and operating rules can all affect the number. Focus on reducing meaningful losses rather than chasing a particular percentage.
Does a higher OEE mean more production?
- Not necessarily. OEE measures how effectively scheduled production time was used, not how many parts were produced. A shorter production period can have a higher OEE while producing fewer parts overall. Use output to understand how much you made and OEE to understand how effectively you used the time available to make it.
Should OEE or output be my main KPI?
- They answer different questions. Output and demand tell you whether you are producing enough. OEE helps explain how effectively scheduled production time is being used and where losses are occurring. For most operational decisions, you want to look at both.
What is the difference between OEE and TEEP?
- OEE measures effectiveness during the time you planned to produce. TEEP expands that view to all available calendar time, including hours that were never scheduled for production. OEE helps you improve the time you already run; TEEP helps you understand how much additional capacity may exist outside that schedule.
Related: live OEE and production monitoring, from spreadsheets to live OEE, and why the five-minute stop is the expensive one
About the author
Adam Singer
Co-Founder, Project and Product Manager
Adam co-founded MAJiK Systems in 2014 and leads project delivery and product development, bringing the voice of the customer directly into the product roadmap. With a background spanning software engineering, industrial connectivity, and manufacturing operations, he has spent more than a decade working directly with manufacturers to turn real production challenges into practical, intuitive software solutions that are easy to understand, adopt, and use.