Your PLC does not speak Sparkplug B. Here is what publishes it for you.
New to Sparkplug B? It is an open MQTT specification from the Eclipse Foundation. The Eclipse Sparkplug site explains it, and build a unified namespace without an Ignition or Kepware stack covers where it fits.
Most guides to Sparkplug B skip a basic question: how does the data get from your machines into it? Most machine controllers cannot send Sparkplug B on their own. They need hardware or software in front of them that acts as a translator.
That translator is called an edge node. It collects data from the controller and sends it in the format Sparkplug B requires. It also tells receiving systems whether the connection is still alive, so they can tell when data has stopped updating.
Choosing that edge node is the key decision when you adopt Sparkplug B, and it has to work with the equipment you already have.
What an edge node has to do, beyond publishing
Sparkplug B is not a topic convention. It is a state machine, and the edge node runs it:
- Birth and death. On connect it publishes an NBIRTH describing every metric it will send. It registers a death certificate with the broker first, so subscribers are told when it drops.
- Sequence numbers. Every message includes a sequence number, and a subscriber that sees a gap asks for a rebirth. That ordering assumption is why the spec requires QoS 0 and no retained messages on data.
- Metric aliases. Names are sent once at birth, then replaced by integer aliases to save bandwidth, which is efficient and makes payloads unreadable in a generic MQTT client.
None of that is optional, and all of it lands on the edge node rather than on your controller.
The part worth knowing before you commit
There are two constraints to understand when using Sparkplug B.
A Sparkplug payload is protobuf, a compact binary format, so you cannot read it with the tools you already use. Open a Sparkplug topic in a generic MQTT client and you get bytes. Debugging means a decoder, which is why "how do I read this payload" is one of the most repeated questions in every Sparkplug forum.
The state model assumes one broker in the path. The specification defines behavior for an edge node, a broker and a host application. It has no message type meaning "a segment of the network between them is unreachable", so a link that fails downstream of your edge node does not produce a death certificate. Subscribers keep the last value they were given and nothing says it is stale. If there is more than one network segment between your edge node and your subscribers, such as a bridge or a VPN, birth and death messages alone will not tell you when data has stopped arriving.
Publish one machine in four commands
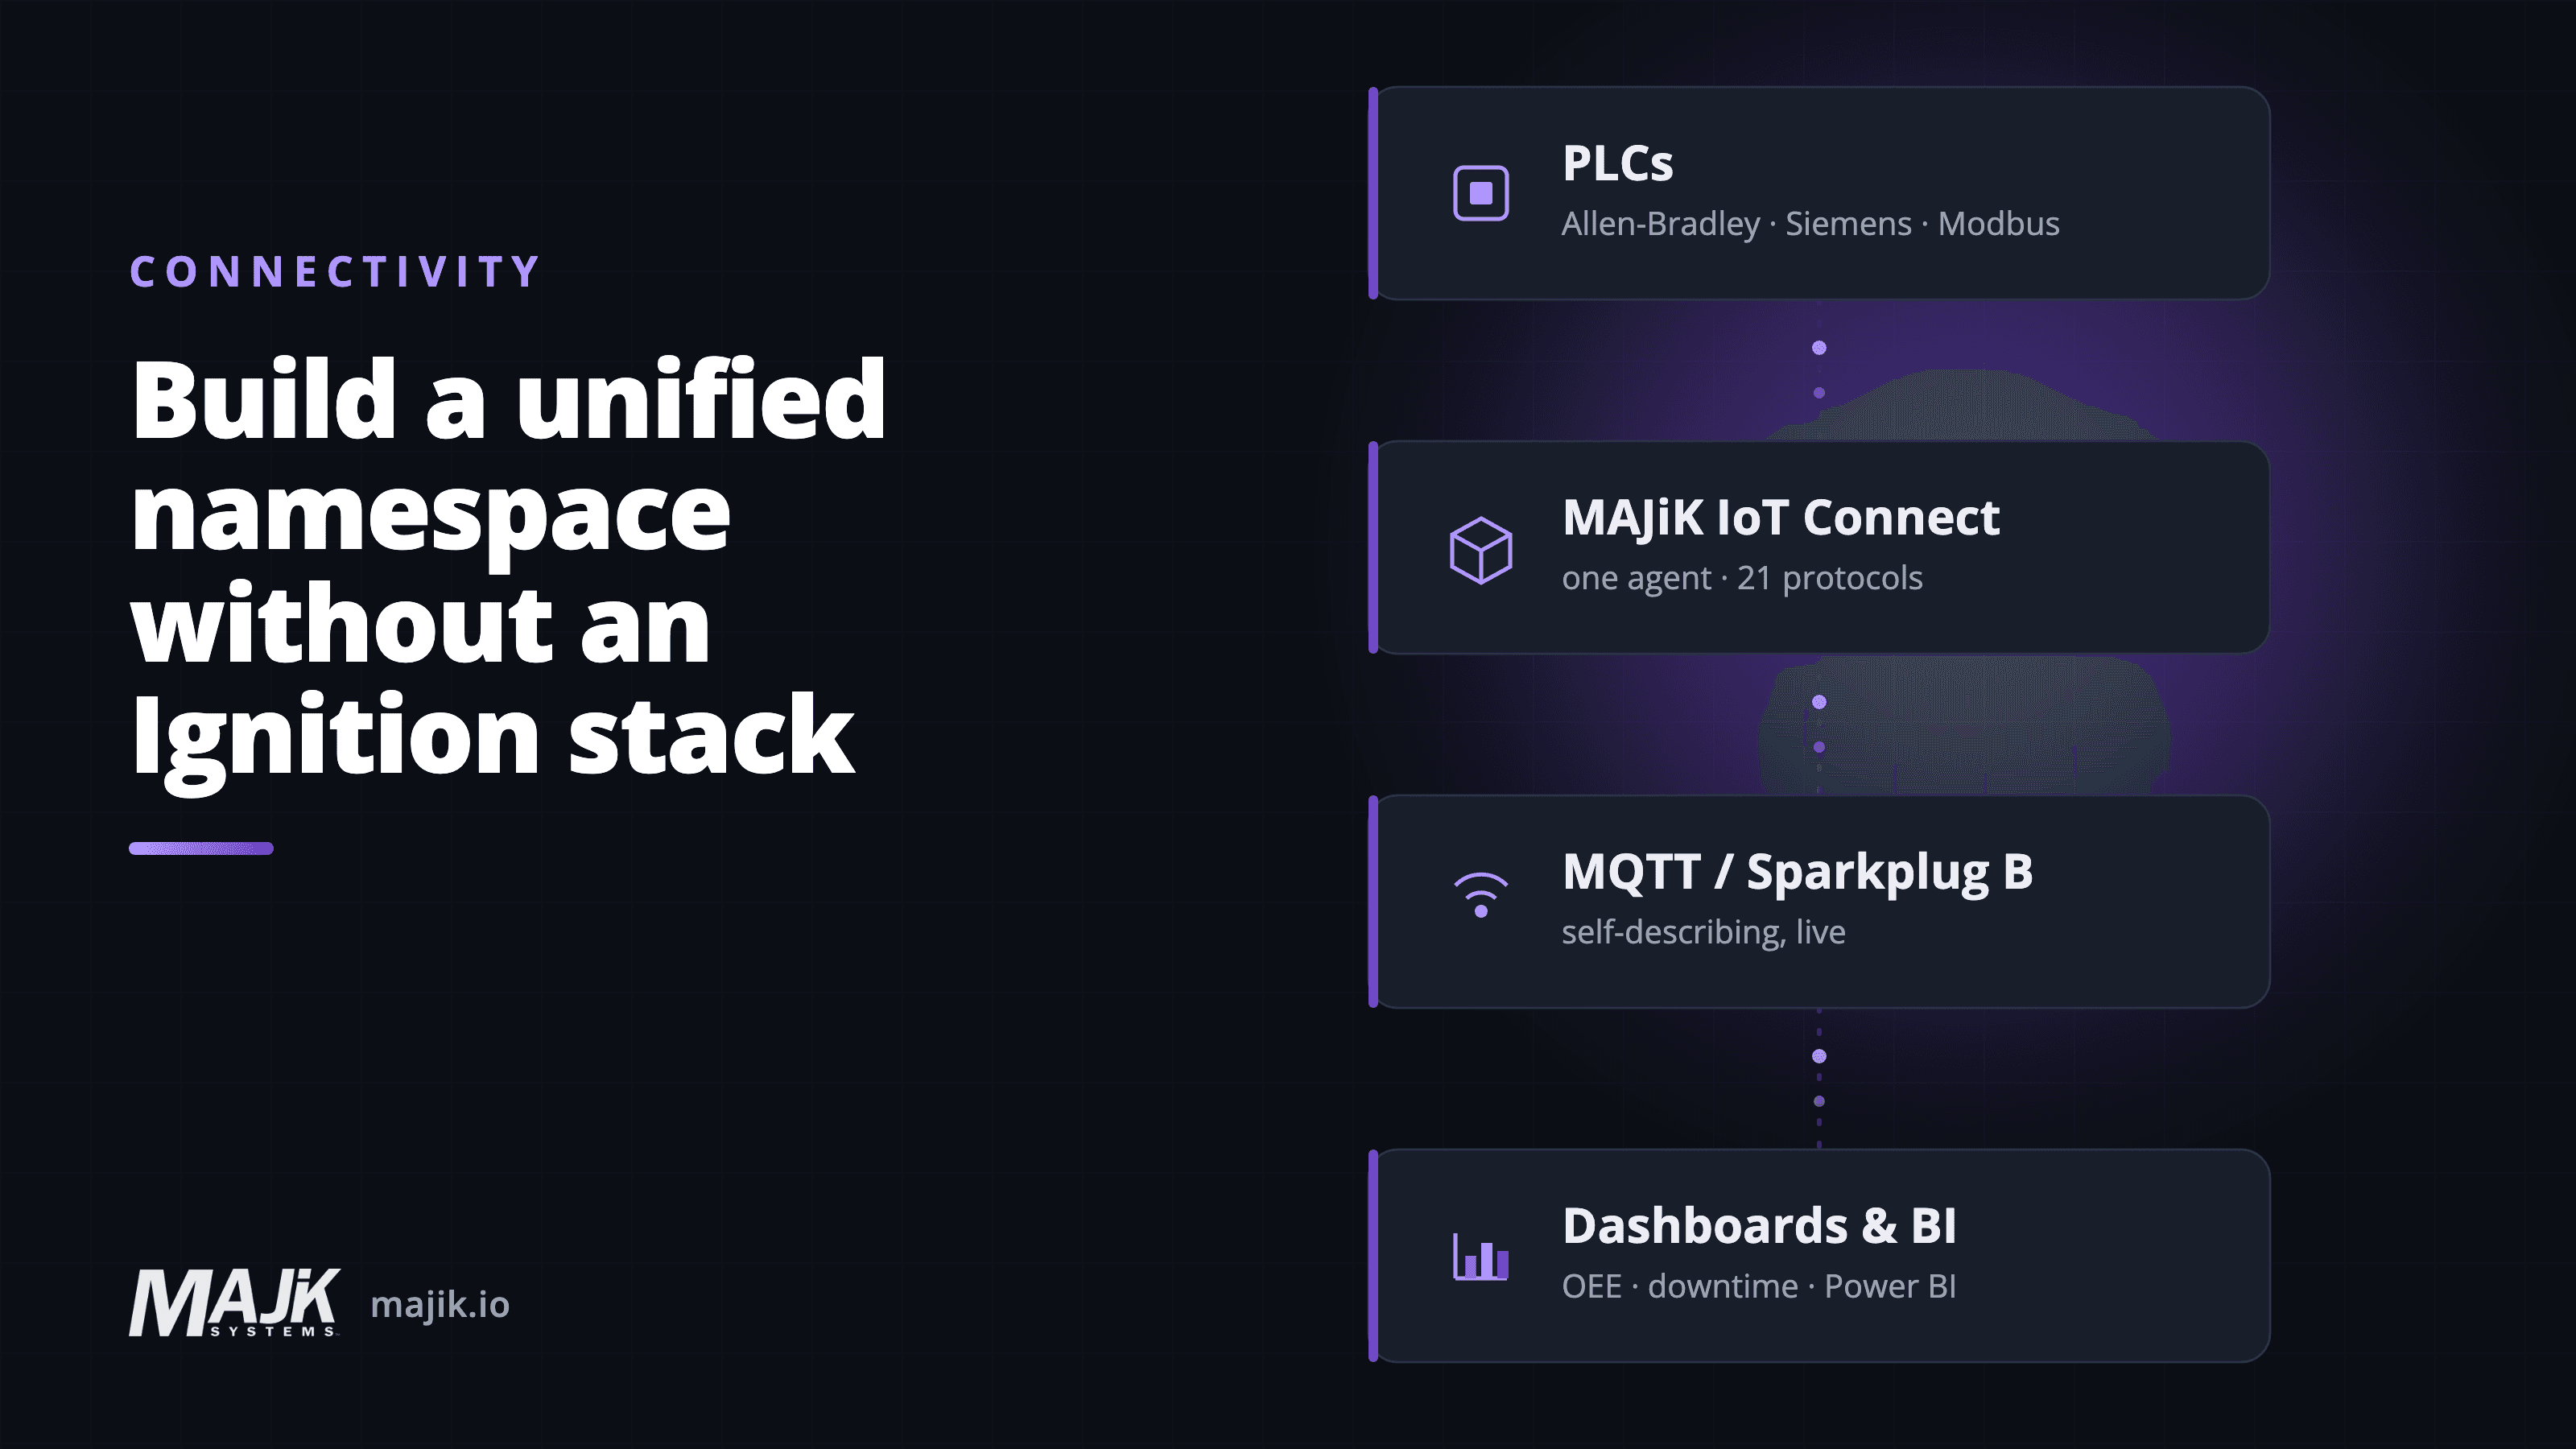
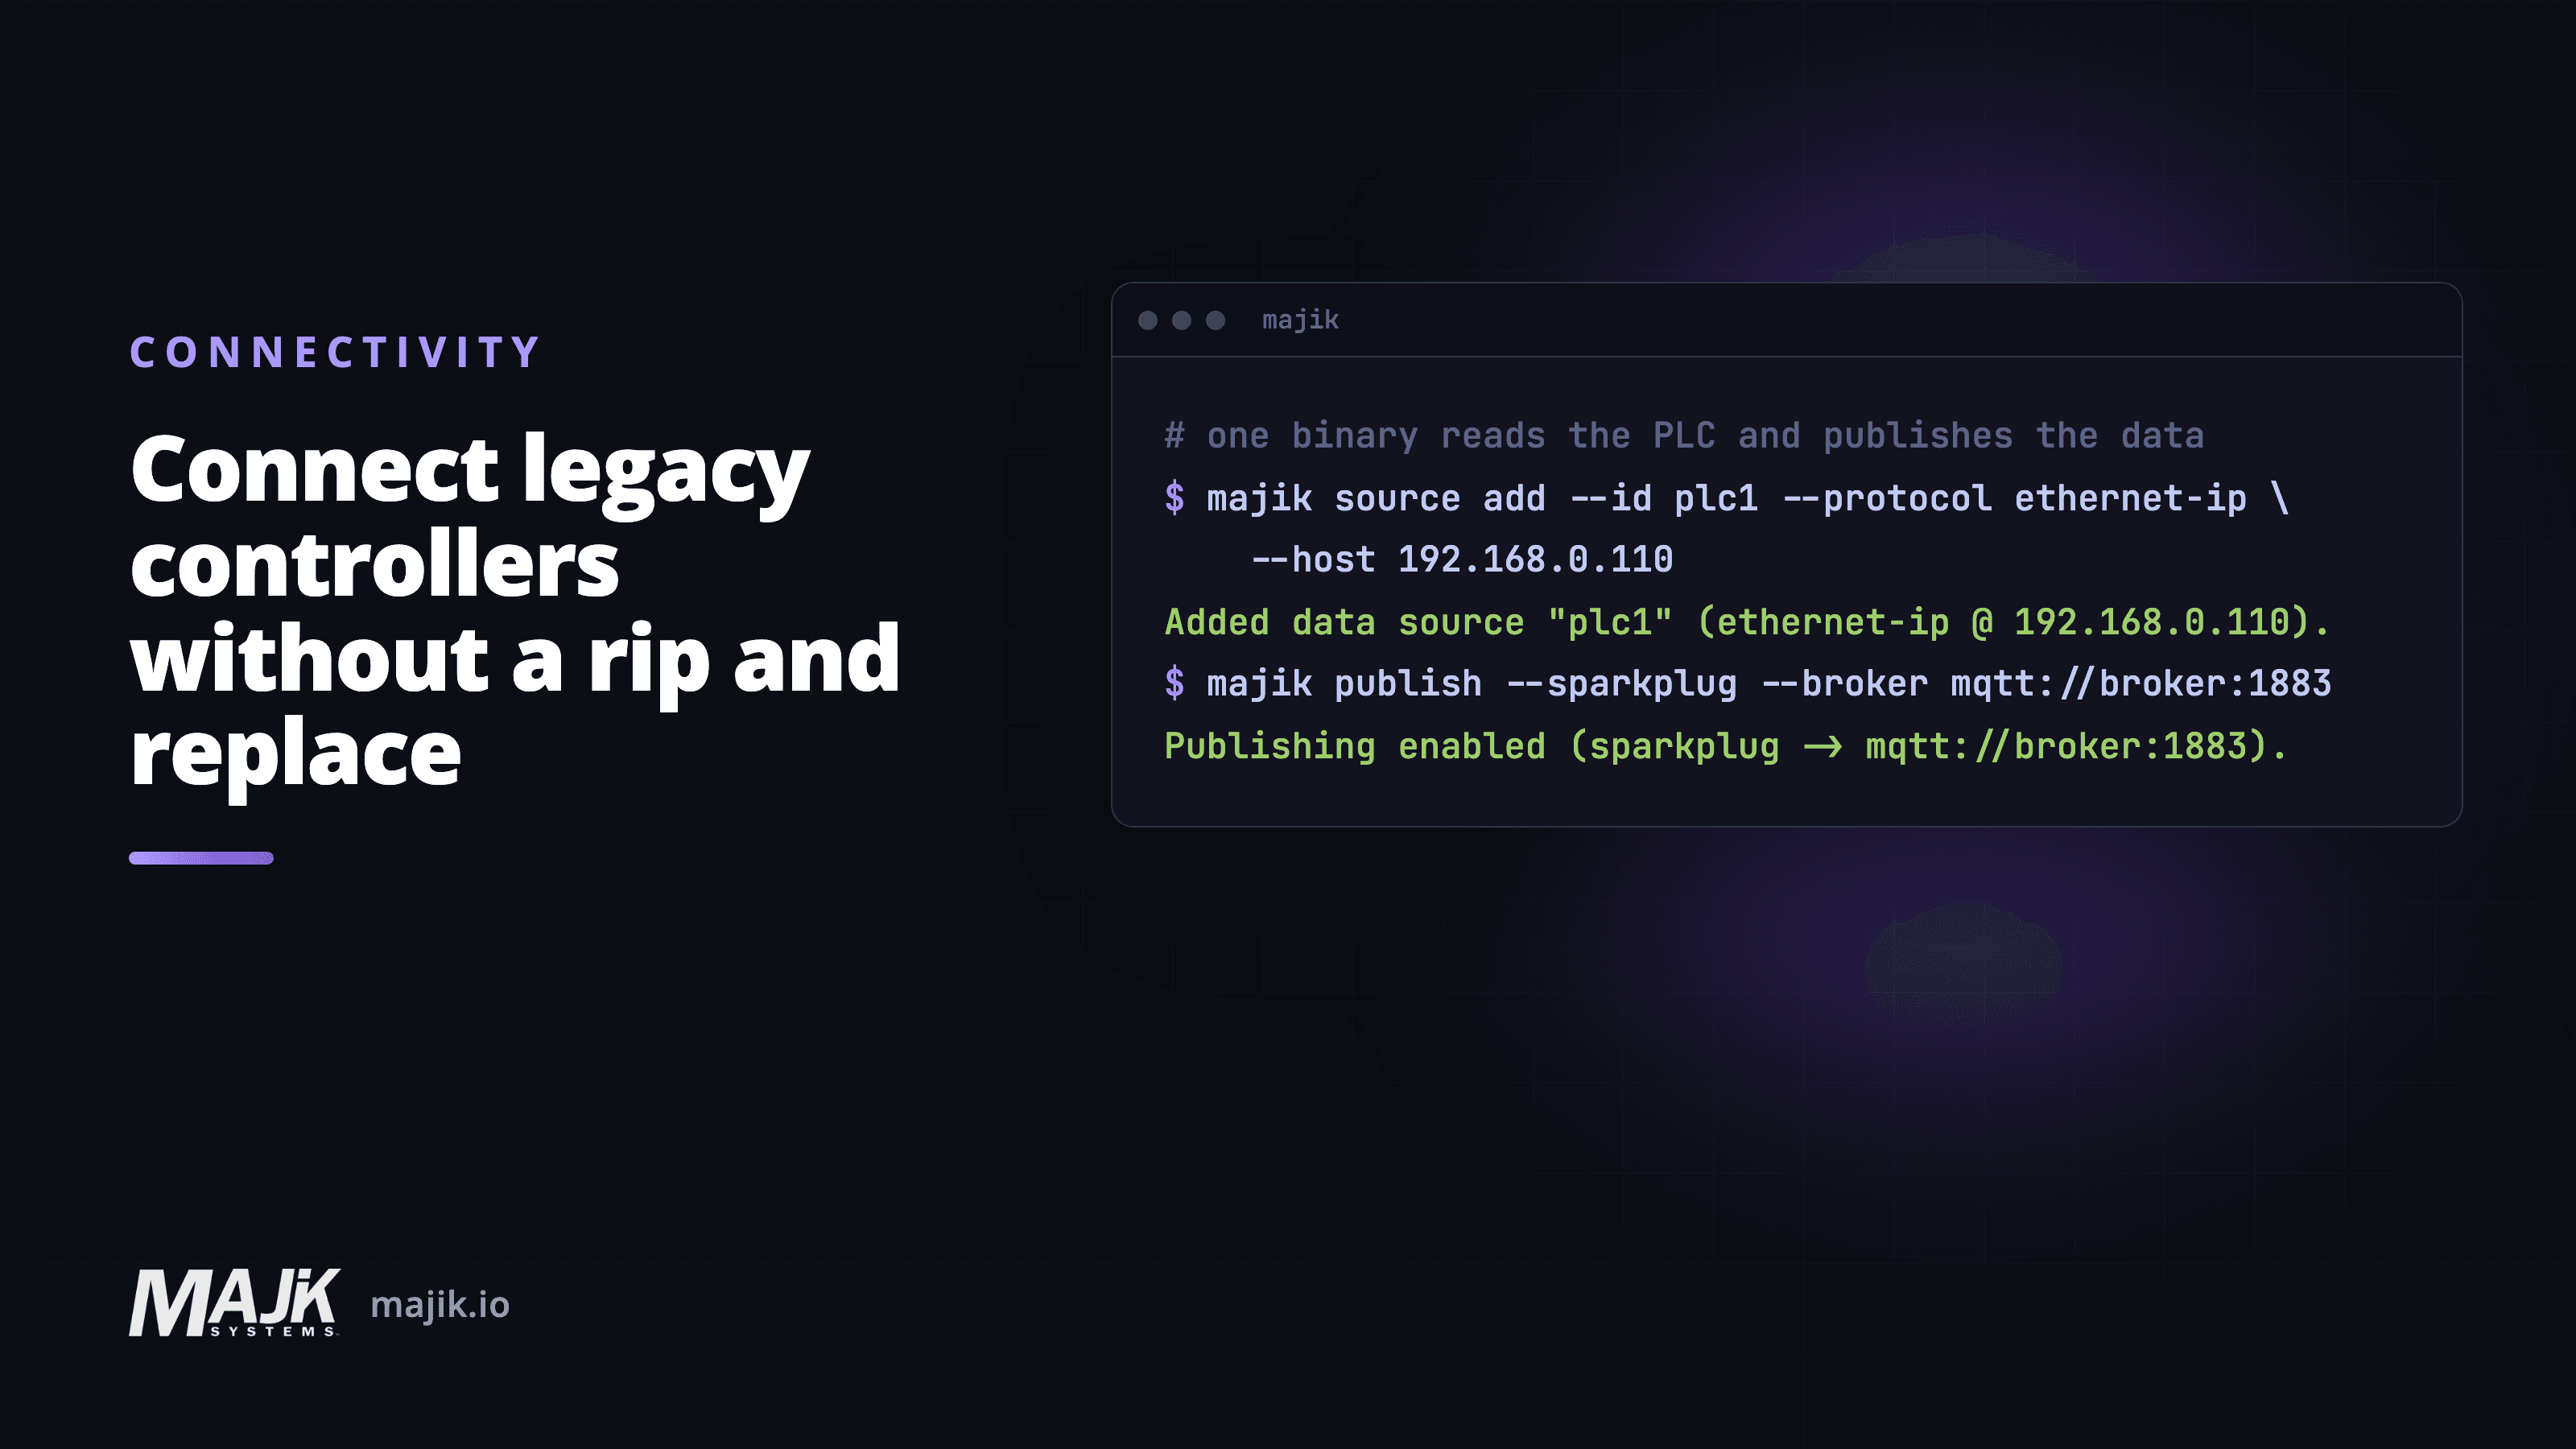
MAJiK IoT Connect is an edge node: it reads the controller natively across 21 protocols, encodes Sparkplug B, and embeds its own MQTT broker in the same program, so there is something to subscribe to the moment it starts.
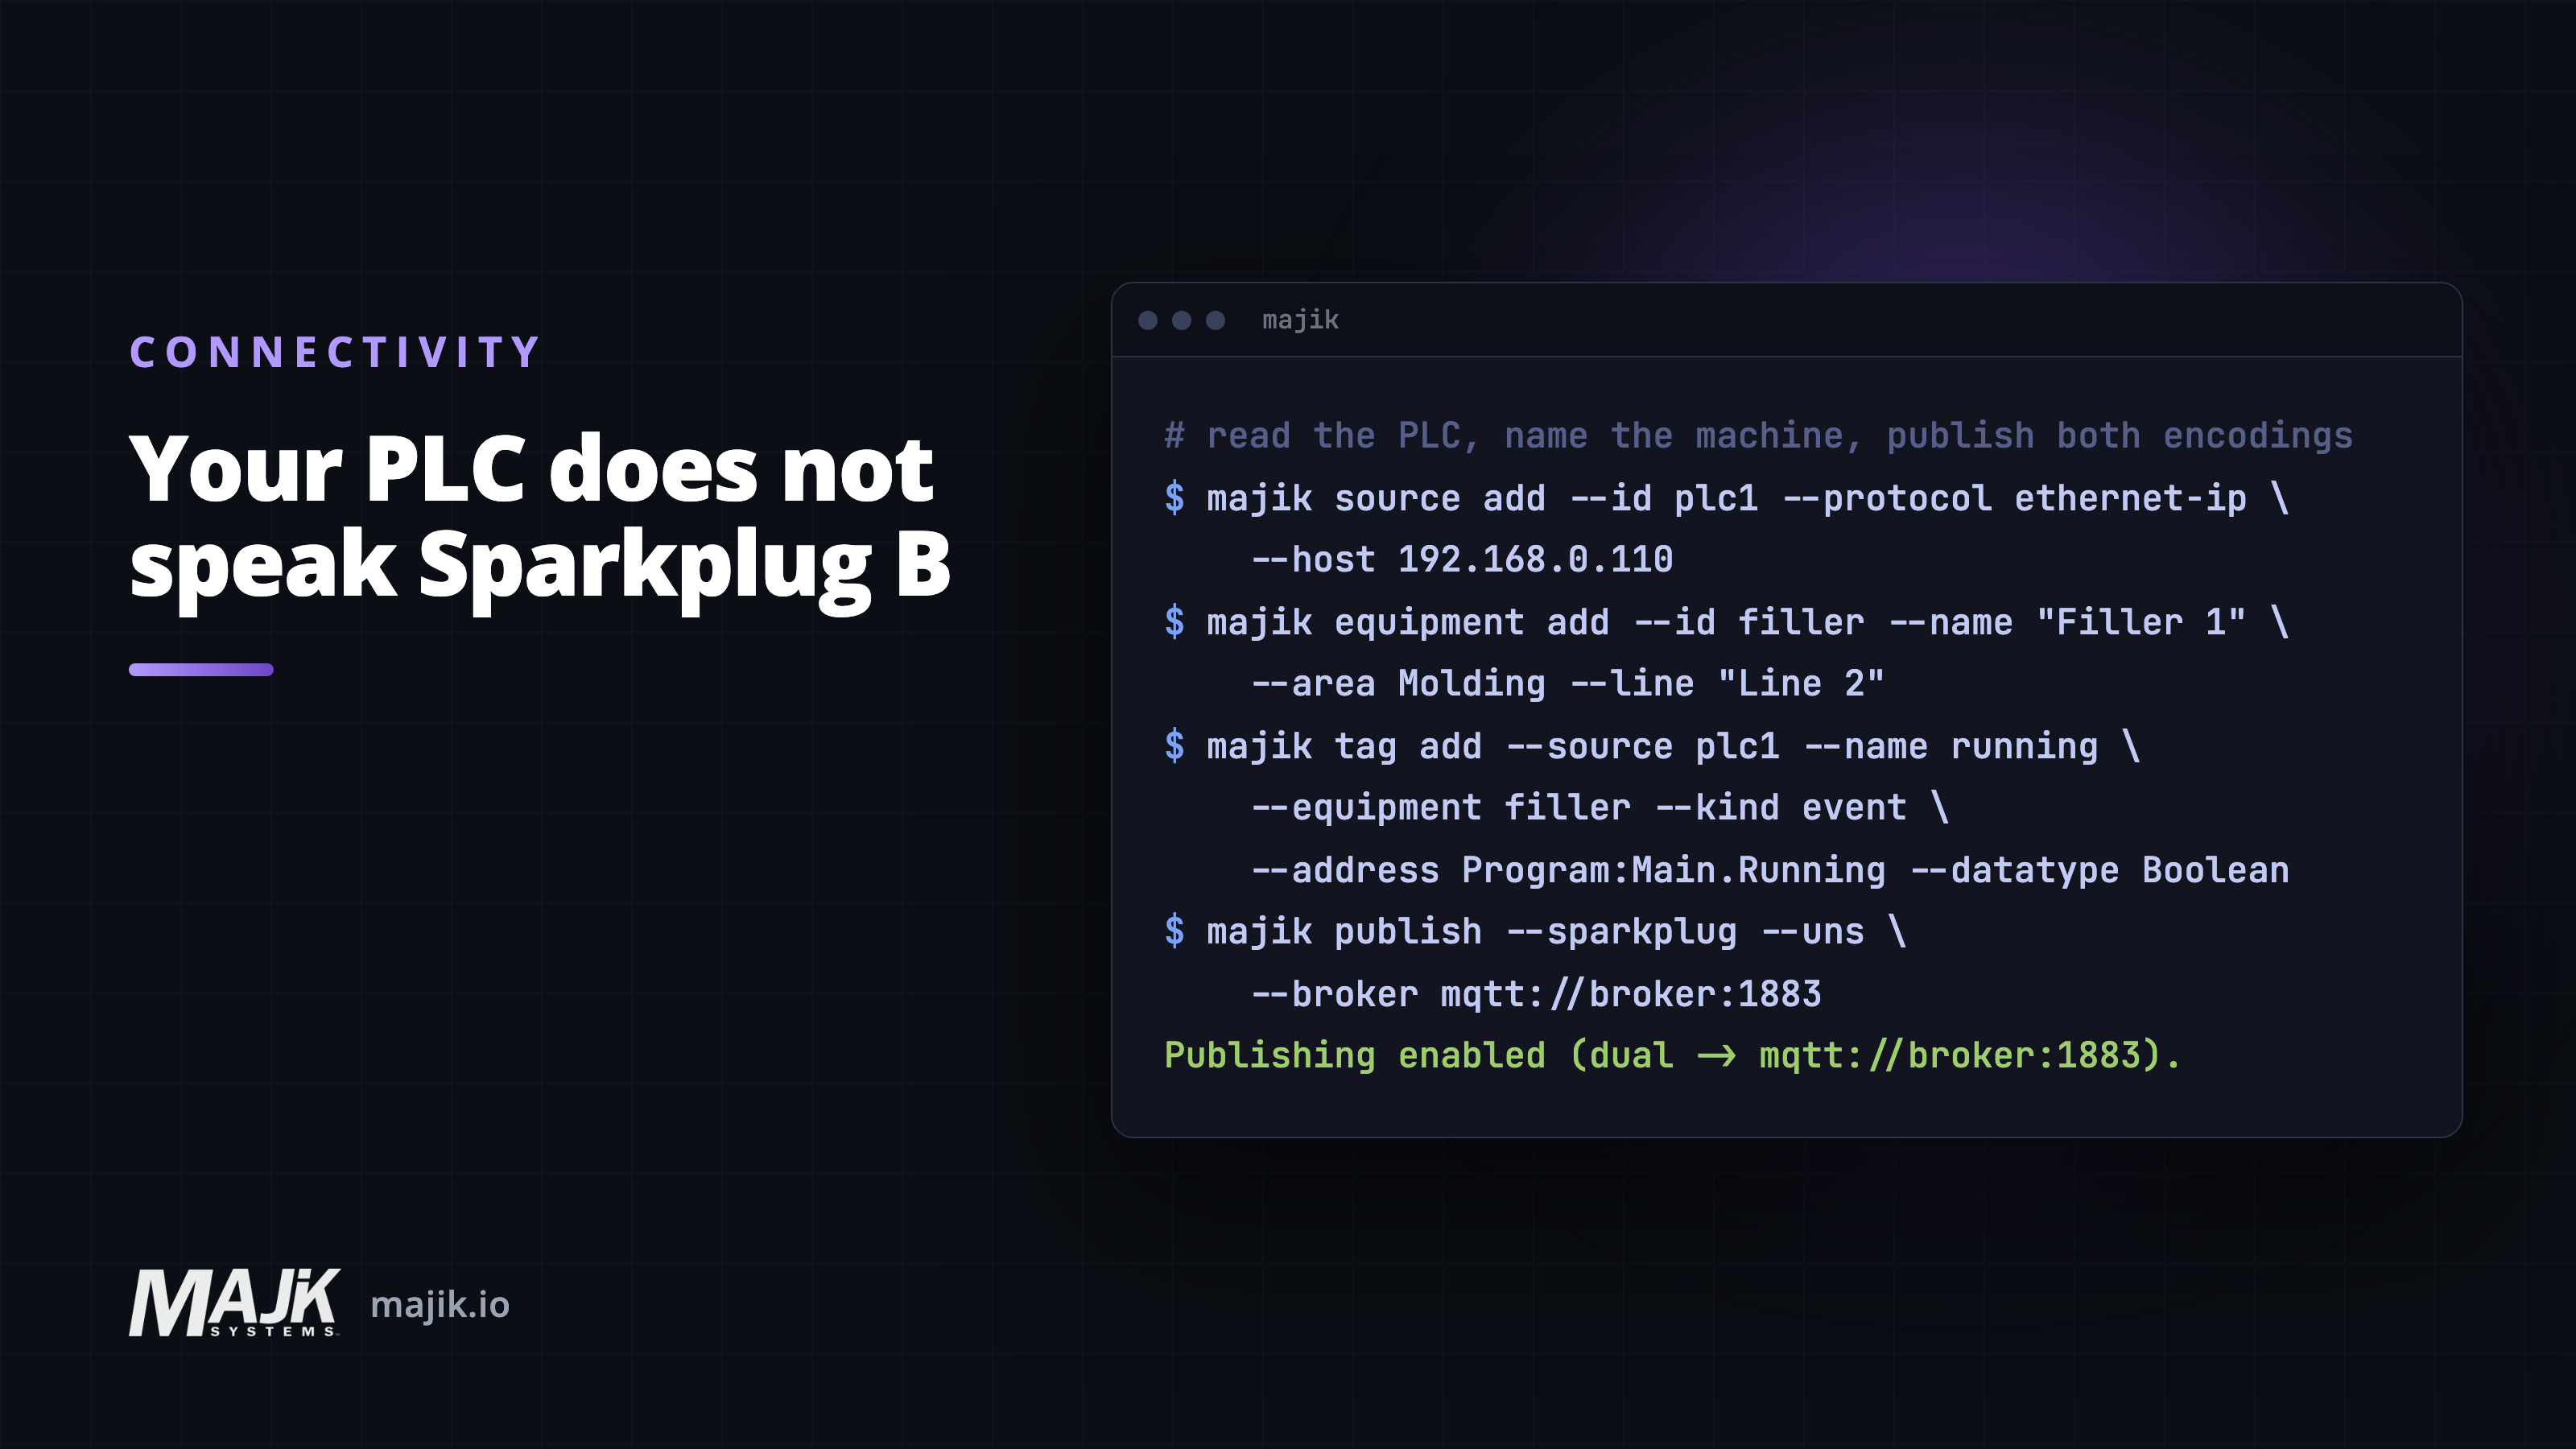
Once the agent is installed on a host on the factory network, you specify four things to start publishing a machine's data: which controller to read from, which machine it belongs to, which tag to publish, and where to send the data. Each one is a single command.
# 1. The controller: read the PLC over EtherNet/IP
majik source add --id plc1 --protocol ethernet-ip --host 192.168.0.110

# 2. The machine: name it and place it in the plant
majik equipment add --id filler --name "Filler 1" --area Molding --line "Line 2"

# 3. The tag: what to read on that machine, published as an event
majik tag add --source plc1 --name running --equipment filler \
  --address Program:Main.Running --datatype Boolean --kind event

# 4. Where it goes: Sparkplug B and plain MQTT topics, to your broker
majik publish --sparkplug --uns --broker mqtt://broker:1883
Each command prints what it did.
The second one is the one worth dwelling on, because it decides what everybody downstream sees. A controller is not a machine. One PLC can run three of them, and the name you gave the connection is an IT detail nobody on the floor recognizes. Declaring the equipment separates the two and assigns the reading to an equipment name your business understands: Molding, Line 2, Filler 1.
The --kind event is the part that changes what a subscriber sees. A boolean on a scan rate arrives as a stream of true and false that every consumer has to compare against the last one to spot a change. Registered as an event, the agent publishes only the transitions. The agent still reads on its scan rate; what stops is the repetition.
Where the value lands in the namespace
With --sparkplug --uns, the last command sends the same reading out two ways: as Sparkplug B with Filler 1 as the device, and as a plain MQTT topic built from the equipment you declared:
uns/acme/waterloo/Molding/Line 2/Filler 1/runningThe first two levels are the enterprise and site the agent was installed for. The rest is the equipment: its area, its line, the machine name, then the tag. So one subscriber can take the Sparkplug stream with its session state, and another can read a topic that means something to someone who has never opened the PLC program. It is one tag mapping either way, and nothing republishes one stream into the other.
For how to choose those levels before there are fifty machines in the tree, read build a unified namespace without an Ignition or Kepware stack.
How does a subscriber know what it is reading?
The birth message lists every tag's name and data type, so a new consumer learns what it is reading without anyone having to send over a tag list. The death message says the edge node has dropped off the moment it does.
Your monitoring, your historian and your BI all read that same stream. For how topic names should be structured across site, area, line and machine, read build a unified namespace without an Ignition or Kepware stack.
Where it gets hard, and it is always after a reconnect
While everything stays connected, this is straightforward. The challenges tend to emerge later, usually in this order:
- Rebirth on reconnect. A reconnecting node republishes every metric with a fresh timestamp. Historians can record that as thousands of new readings for values that did not change, which is correct Sparkplug behavior but still leads to incorrect reporting.
- Buffered data on the way back. Every store-and-forward buffer has a limit. MAJiK IoT Connect's holds 100,000 messages or 1 GB on disk, whichever comes first, and drops the oldest past that. Buffered readings come back after the new birth message with their original timestamps, so check that your historian stores them as history rather than as live values.
- Whatever sits between you and the subscriber. A bridge, a VPN, a cloud endpoint. Sparkplug will not tell you that segment died, so have your subscribers watch for data that stops arriving, not just for a death message.
How does MAJiK IoT Connect help with these?
- It buffers when the uplink drops, up to 100,000 messages or 1 GB on disk, and replays the oldest first on reconnect.
- It reports its own health, including whether it is connected to the broker, how deep the buffer is and the state of each data source, over OpenTelemetry or a Prometheus port, so a stalled link shows up in the tools you already watch.
- Every value carries a quality flag, so a stale reading is marked rather than passed on as good.
- It publishes plain MQTT topics alongside Sparkplug B, so a historian that does not need session state can read those instead.
Try it on one machine before you scale to a hundred: see how MAJiK IoT Connect works.
Is the command line the only way to set this up?
No. Four commands are here to show how simple publishing a machine with Sparkplug B can be. The command line is one of several ways to drive the same agent, and they all edit the same configuration, so you can start in one and finish in another:
- Desktop app. Configure agents, browse tags and watch live data from your own computer.
- Interactive terminal. A full-screen, keyboard-driven dashboard that works over a remote SSH session, no browser needed.
- Configuration as code. One YAML file declares what the agent reads and where it publishes, so a change can be reviewed, diffed and rolled back.
- Cloud console, coming soon. One browser view for managing agents across every site.
You also choose how far management reaches, to match your security policy: local on the box itself, which suits an air-gapped line, the local network inside your own firewall, or, once the cloud console ships, the cloud across every site. Every level runs over the same control plane: outbound-only, encrypted with TLS, and authenticated by the agent's own credential, so no inbound firewall port is opened.
See every way to drive MAJiK IoT Connect and the security model.
Frequently asked questions
Do any PLCs publish Sparkplug B natively?
- Very few. The Eclipse Sparkplug compatible hardware list has six entries from two vendors, Opto 22 and SignalFire. For everything else an edge node reads the controller in its own protocol and publishes on its behalf.
Do I need Ignition or Cirrus Link to publish Sparkplug B?
- No. Those are one way to run an edge node, and a good one if you already use Ignition as your SCADA. MAJiK IoT Connect reads the PLC and publishes Sparkplug B directly from one program, which is the better fit when you would rather not run a platform to move data.
Does a Sparkplug broker have to be special?
- No. Any MQTT broker routes the messages. Some brokers add Sparkplug awareness, which helps a host application catch up on state, but the payload is ordinary MQTT.
What is protobuf?
- Protocol Buffers, a standard binary format from Google for packing structured data into small messages. Sparkplug B encodes every payload with it, which keeps messages small but means you need a Sparkplug decoder to read them.
Why Sparkplug B rather than plain MQTT topics?
- Self-description and session state. The birth message names every metric and its data type, and the death message tells it when the publisher went away. If you do not need either, plain topics are simpler and readable in any client.
Does it write to the PLC?
- No. It reads PLC data and publishes it. It does not write to the controller.
About the author
Kamal Aman
Co-Founder and CTO
Kamal co-founded MAJiK Systems in 2014 and is its CTO. He built the connectivity that gets live data off equipment nobody expected to talk, from current PLCs to controllers older than the network they sit on.